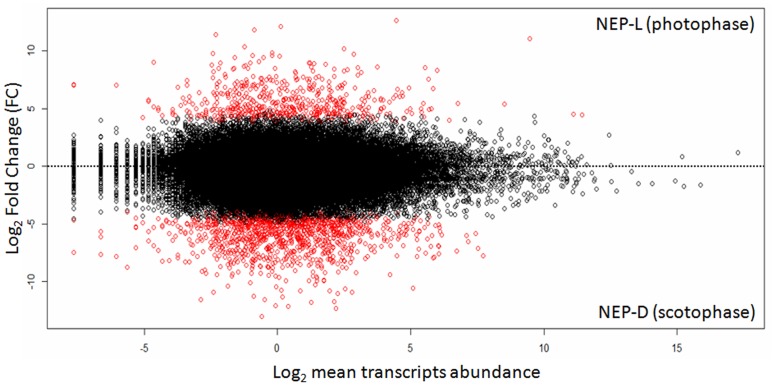
Fig 4. Fold change and abundance levels of transcripts.
Different expression values of the two lobsters NEP-L and NEP-D. The black dots represent the equally expressed transcripts, while the red ones the differently expressed. The x-axis represents the Log2 of transcripts abundances. The y-axis represents the fold changes in abundances. In the upper part of the graph are plotted the transcripts of NEP-L and in the bottom part NEP-D.

