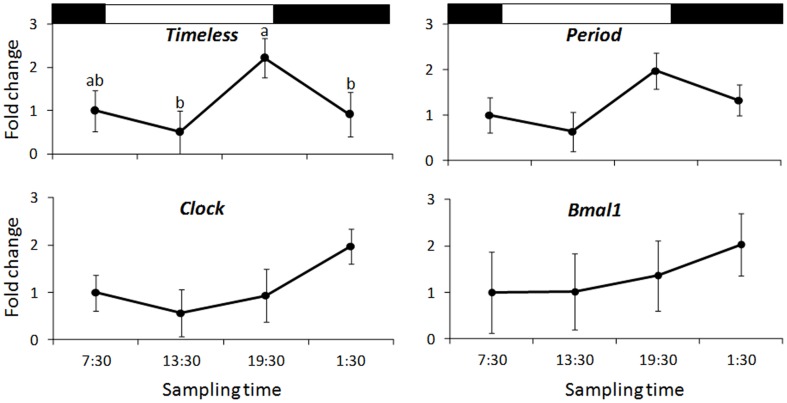
Fig 5. Canonical clock genes expression (RT-qPCR).
Canonical clock genes expression in Nephrops eyestalk. Measurements (n = 3 each time point) were normalized to α-act and 18S and expressed as fold change respect to a control time point (7:30). Vertical bars represent the confidence limits. Black and white bars represent darkness and light hours, respectively. Timeless shows a significant pattern of expression (ANOVA, P < 0.05). Letters indicate the output of the Tukey’s post hoc test (a>b).

