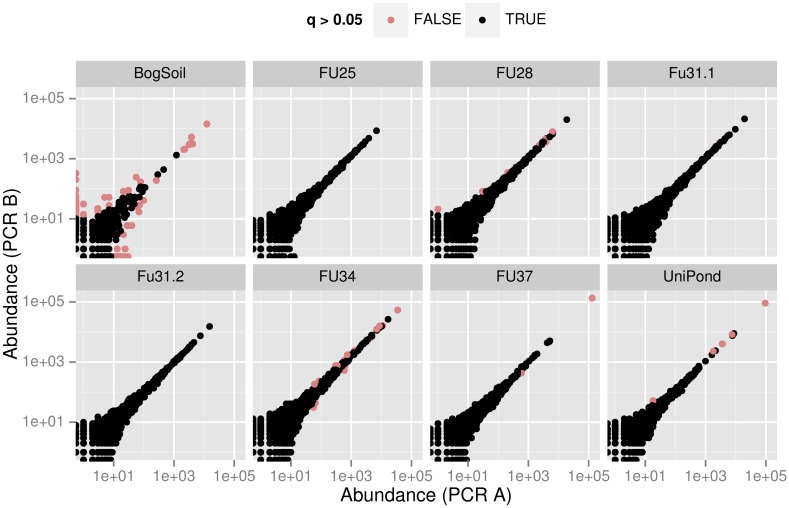
Fig 3. Discordance plot showing significant deviations of eukaryote read numbers between split samples.
For each of the samples S an individual panel shows the logarithmically scaled pairs of read numbers (r iAS, r iBS) of unique sequences i in PCR branches X ∈ {A, B}. Red and black points correspond to, respectively, sequences with and without significantly deviating r iAS, r iBS (false discovery rate q ≤ 0.05 or q > 0.05, respectively).

