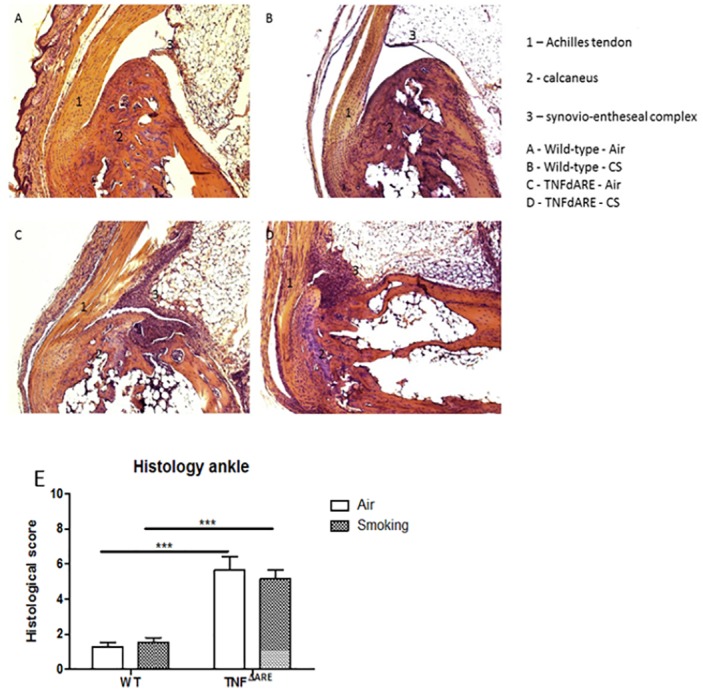
Fig 6. Histology of the joints in WT and TNFΔARE mice.

H&E staining of the ankle joints of (A) air-exposed WT mice, (B) CS-exposed WT mice, (C) air-exposed TNFΔARE mice and (D) CS-exposed TNFΔARE mice. (E) Histological score of inflammation in the joints of WT and TNFΔARE mice. Histological inflammation is increased in TNFΔARE mice compared to WT mice (p < 0,005). Data are expressed as mean ± SEM. * p<0.05, ** p<0.01, *** p<0.001.
