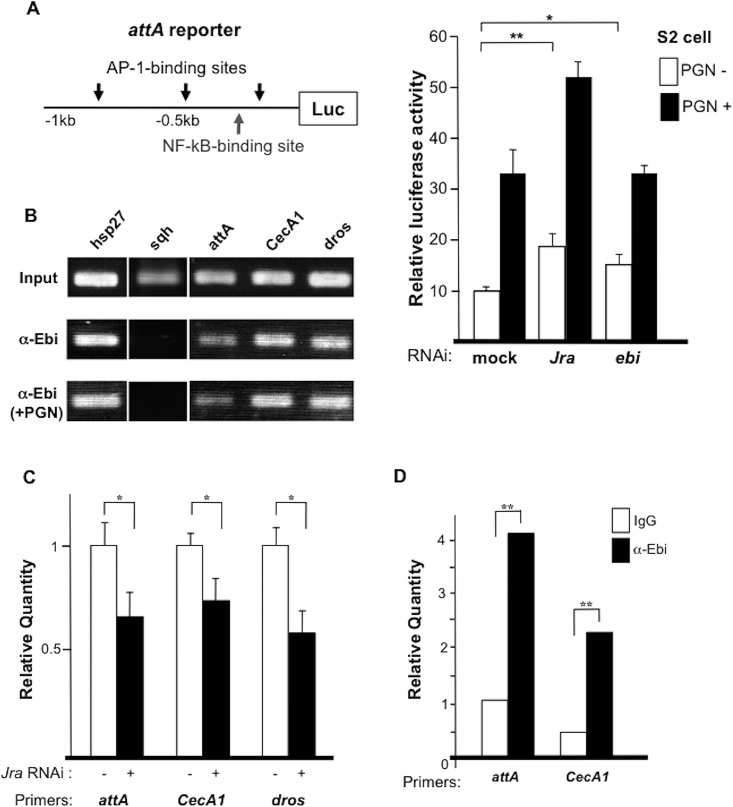
Fig 6. Ebi directly regulates the expression of AMPs.
(A) Left: Reporter analysis using the attA promoter region; right: dsRNA-mediated knockdown of Jra or ebi in the absence or presence of peptidoglycan (PGN). Data represent the mean ± SD. *p < 0.05; **p < 0.01. The experiment was performed three times. (B) ChIP analysis using different AMPs as a probe. The positive control was hsp27. The experiment was performed two times. (C) ChIP-qPCR results obtained with primers specific to the promoter regions of AMPs with anti-Ebi in the absence (white bars) or presence (black bars) of Jra-specific dsRNA in S2 cells. Amplification was normalized to the control without dsRNA treatment. In all cases, the enrichment of each promoter region was inhibited by dsRNA against Jra. Data represent the mean ± SD. *p < 0.05; **p < 0.01. The experiment was performed three times. (D) ChIP-qPCR results obtained with primers specific to the promoter regions of AMPs (attA and CecA1) with anti-Ebi (black bar) or IgG (white bar) in fat bodies (n = 100). Amplification was normalized to the internal control and calculated for each input. **p < 0.01.

