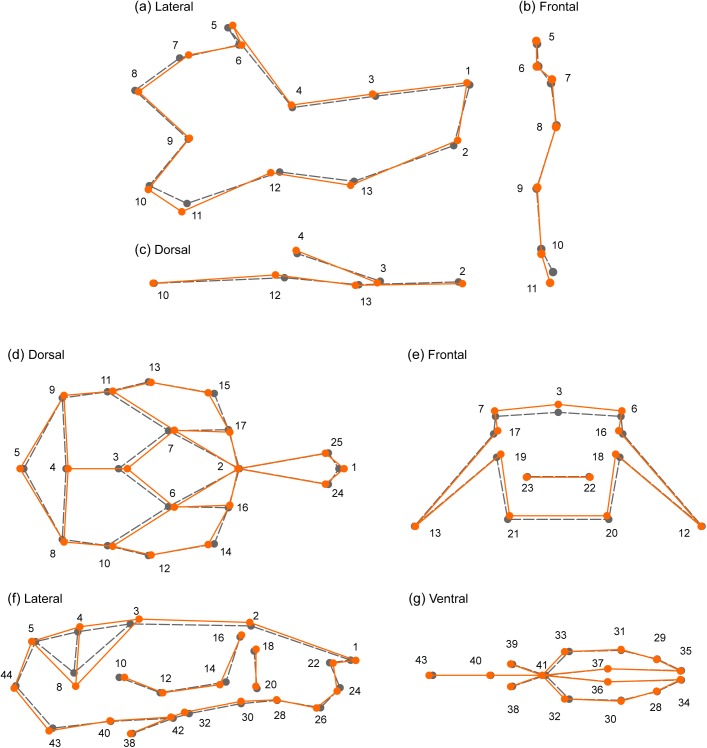
Fig 4. Changes in mandible (a-c) and skull (d-g) shape associated with the SNPs of largest effect.
SNP rs33702397 explains 2% of skull shape variation, and rs33614268 explains 1.4% of mandible shape variation. The sample mean shape is depicted in grey (dotted line). In orange (continuous line) is the mean shape associated to the SNP effect, scaled 10x. For mandible, (a) lateral, (b) frontal, and (c) dorsal views are shown. For skull, (d) dorsal, (e) frontal, (f) lateral, and (g) ventral views are shown. Dots and numbers represent relevant landmarks for each view.

