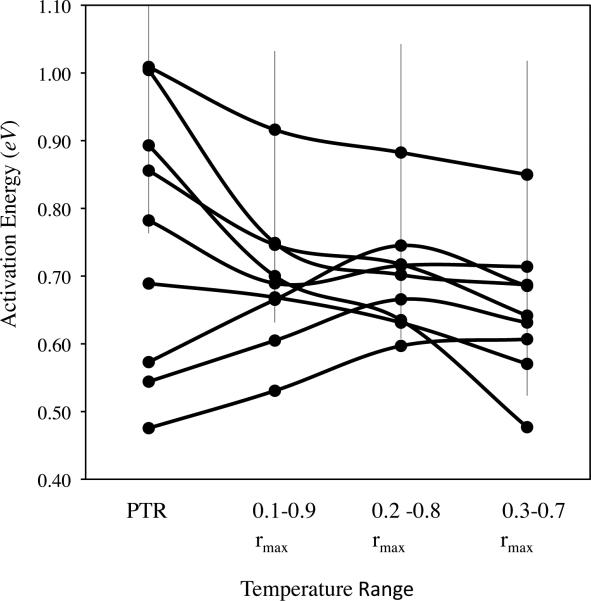
Figure 2.
Linear slopes (activation energy estimates) as a function of temperature range for microbial species. These data are for the species from Ratkowsky et al. (2005). PTR represents the physiological temperature range and includes temperatures greater than 0°C and less than Topt. For species (Escherichia coli, Listeria monocytogenes and Streptococcus thermophilus) where there was more than 1 dataset, error bars are shown for the standard deviation in the slope estimate.

