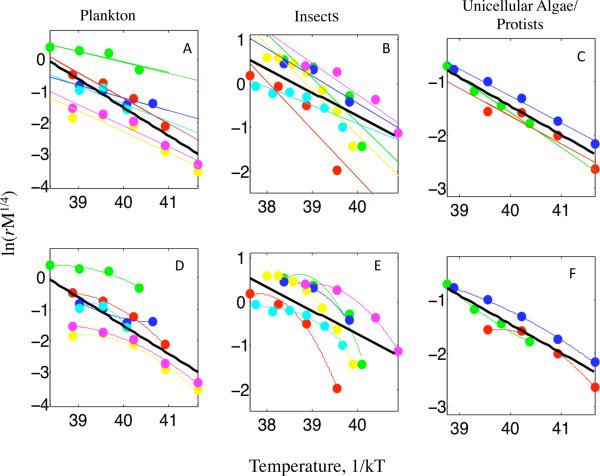
Figure 3.
Linear UTD model fit to diverse organisms. The 3 types of organisms in Savage et al. (2004) are each shown in a panel. A-C. The top row of each panel is the shows the best fit line to each species and the species data points. The best-fit line to the combined species data is shown in black. D-F. The bottom row of each panel shows the best-fit polynomial of degree 2 for each species. The best-fit line to the combined species data is still shown in black.

