
Figure 4.
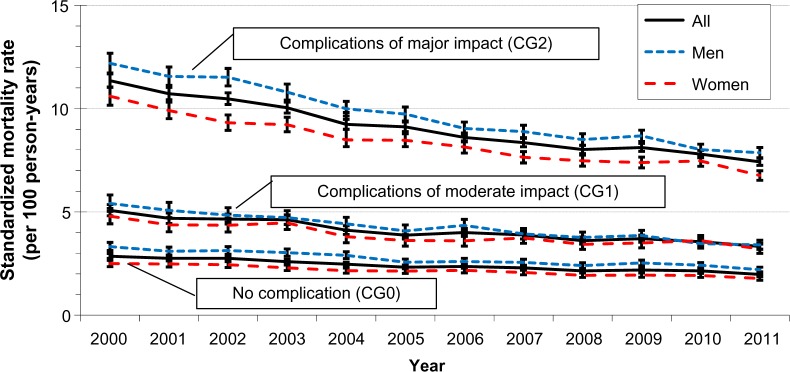
Standardized mortality rates by complication group, 2000–2011, (per 100 person-years).
Official websites use .gov
A
.gov website belongs to an official
government organization in the United States.
Secure .gov websites use HTTPS
A lock (
) or https:// means you've safely
connected to the .gov website. Share sensitive
information only on official, secure websites.
Standardized mortality rates by complication group, 2000–2011, (per 100 person-years).