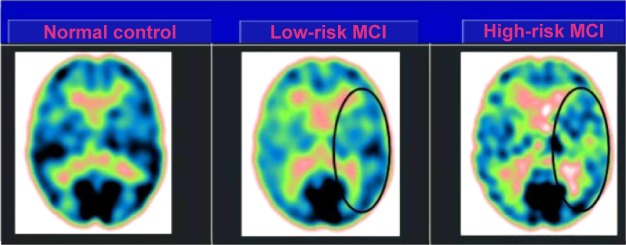
Figure 3.

SPECT visual rating.
Notes: The output shows a SPECT visual inspection of glucose uptake metabolism: the black oval denotes an area of mild-to-moderate temporoparietal hypometabolism in one of the 14 low-risk MCI patients and in one of the 13 high-risk MCI patients respective to one of the 17 enrolled controls.
Abbreviations: SPECT, single-photon emission computed tomography; MCI, mild cognitive impairment.
