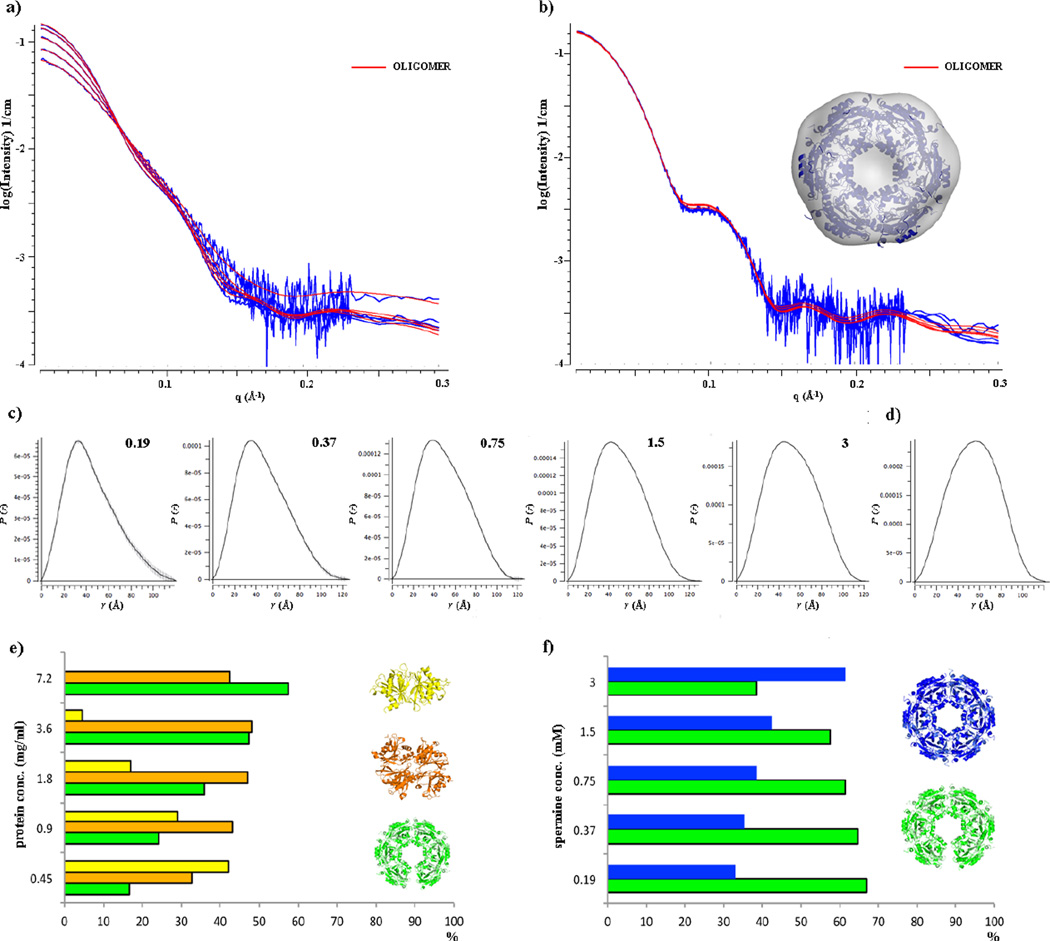
Fig. 5.
SAXS analysis of SpeG in ligand-free form and in complex with polyamine. (a) and (b) Scattering curves for the SpeG in ligand-free form and in presence of spermine, respectively. The fit of SpeG structural models with OLIGOMER [13] to experimental data is shown in red. (c) and (d) P(r) function distributions for the SpeG in ligand-free form and in presence of the polyamine, respectively. (e) Distribution of SpeG oligomeric states in ligand-free form vs protein concentration. (f) Distribution of SpeG oligomeric states in presence of polyamine in solution vs spermine concentration.

