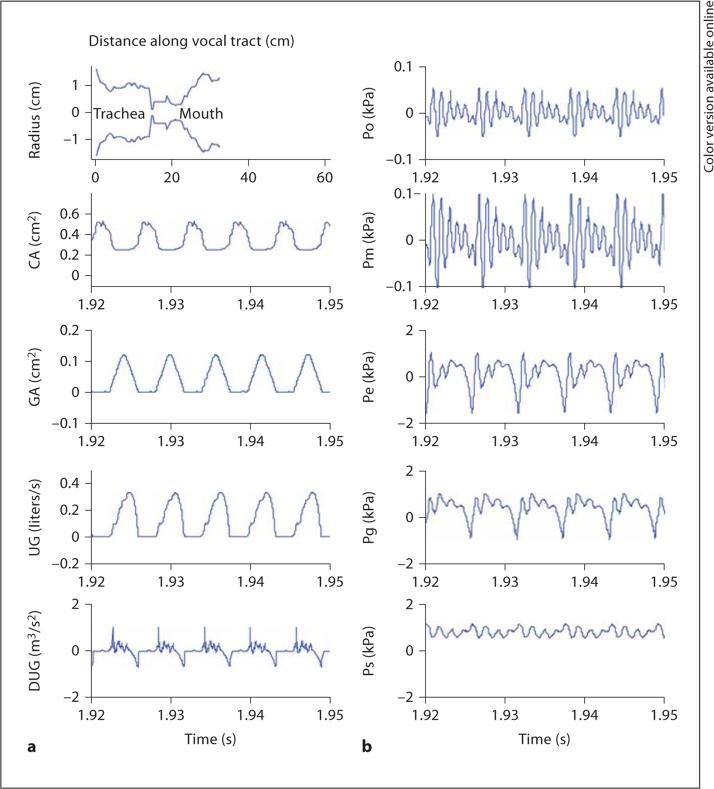
Fig. 5.
Simulated waveforms for lung pressure = 0.8 kPa, CT activity = 1.9%, LCA activity = 21.25%, TA activity = 14.8%, and interarytenoid activity = 35%. The vowel was |i|, with an epilarynx tube area of 0.5 cm2. a Top to bottom: vocal tract outline, contact area (CA), glottal area (GA), glottal flow (UG), glottal flow derivative (DUG). b Top to bottom: radiated oral pressure (Po), mouth pressure behind lips (Pm), epilarynx tube input pressure (Pe), intraglottal pressure (Pg), and subglottal pressure (Ps).

