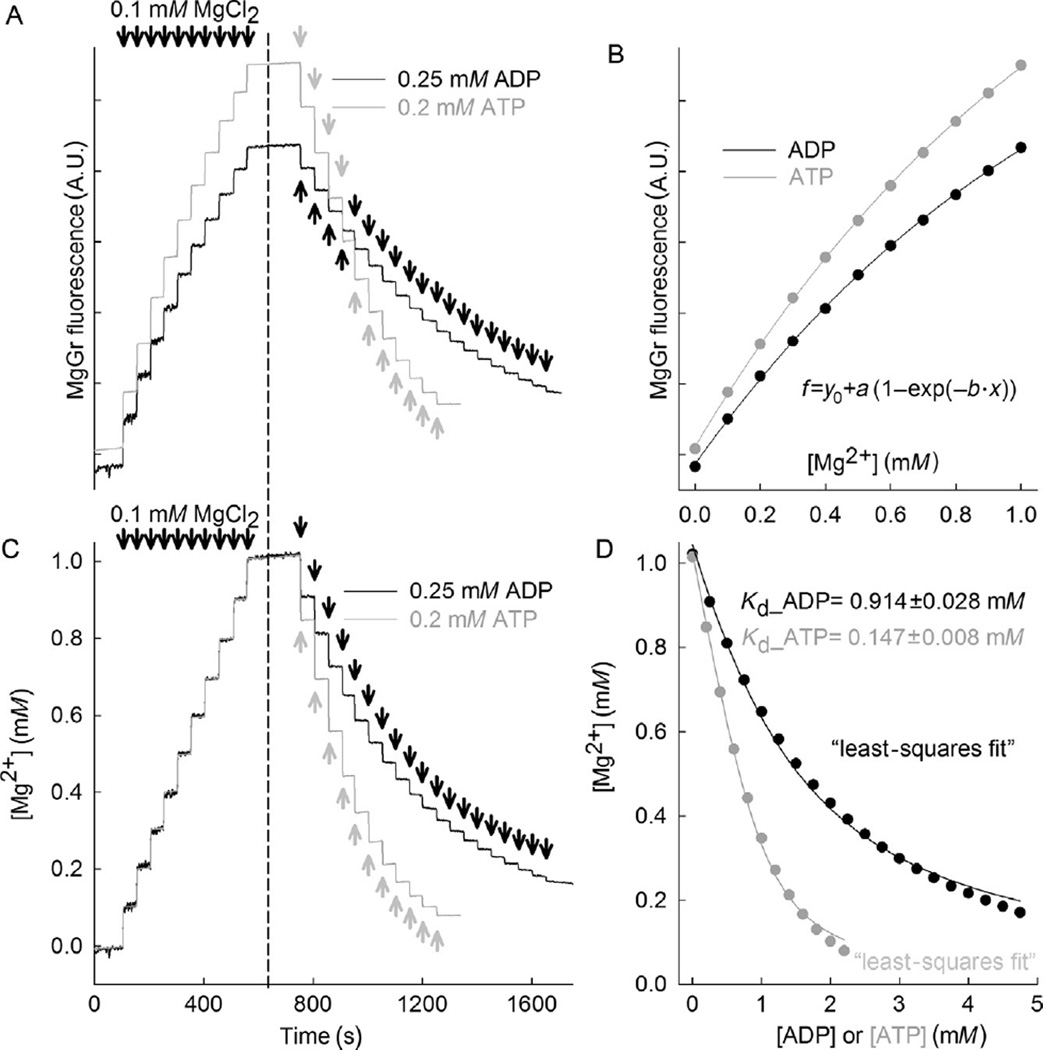
Figure 17.1. Magnesium Green fluorescence calibration and estimation of Kd of ATP and ADP for Mg2+.
(A) Reconstructed time recordings of MgGr raw fluorescence traces in permeabilized HEK293 cells as a function of extramitochondrial [Mg2+] (left part of the traces), and as a function of extramitochondrial ADP or ATP (right parts of the traces). (B) MgGr fluorescence changes are dependent on extramitochondrial [Mg2+]. (C) Calibrated time recordings of extramitochondrial [Mg2+] (left part of the traces), and as a function of extramitochondrial ADP and ATP (right parts of the traces) are shown. (D) Calibrated extramitochondrial Mg2+ plots as a function of ADP or ATP are shown, from which we estimated Kd of ADP and ATP for Mg2+ using the least squares method to fit the data.

