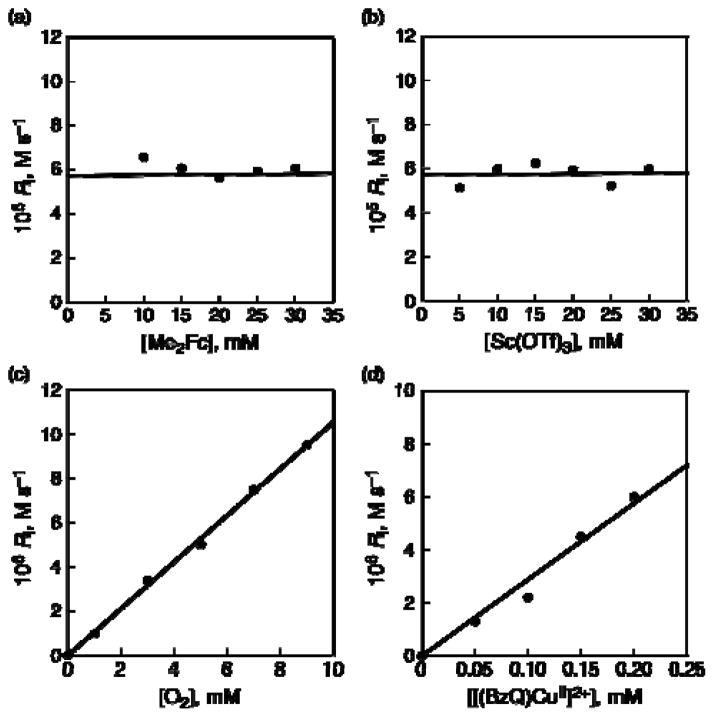
Figure 9.
(a) Plot of the initial rate of formation of Me2Fc+ vs [Me2Fc] in the two-electron reduction of O2 by Me2Fc with Sc(OTf)3 (10 mM) catalyzed by 2 (0.2 mM) in saturated ([O2] = 11 mM) acetone at 298 K. (b) Plot of the initial rate of formation of Me2Fc+ vs [Sc(OTf)3] in the two-electron reduction of O2 by Me2Fc (10 mM) with Sc(OTf)3 catalyzed by 2 (0.20 mM) in saturated ([O2] = 11 mM) acetone at 298 K. (c) Plot of kobs vs [O2] for the two-electron reduction of O2 by Me2Fc (10 mM) with Sc(OTf)3 (10 mM) catalyzed by 2 (0.2 mM) in acetone at 298 K. (d) Plot of kobs vs [2] for the two-electron reduction of O2 by Me2Fc (10 mM) with Sc(OTf)3 (10 mM) catalyzed by 2 in saturated ([O2] = 11 mM) acetone at 298 K.

