
Figure 2. Testing the sensitivity of SAC signaling steps to the attachment status of the kinetochore.
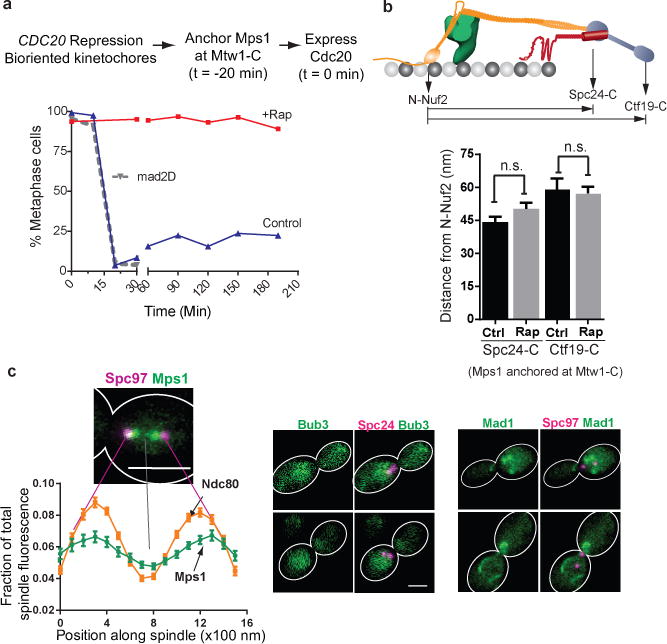
(a) Cell cycle progression of three different strains following release from metaphase arrest (methodology indicated at the top, see Methods for details). Solid lines indicate cell cycle progress of a strain expressing Mtw1-2xFkbp12 and Mps1-Frb released into media with (red) or without (blue) rapamycin. The dotted gray line indicates cell cycle progression of a mad2∆ strain similarly released from metaphase arrest. Plotted points represent the average values calculated from 2 independent experiments. The source data are shown in Supplementary Table 3.
(b) Separation between the centroids of fluorescently labeled kinetochore proteins along the spindle axis obtained by high-resolution colocalization in unperturbed metaphase cells (ctrl.) and rapamycin treated cells (rap. – rapamycin added to anchor Mps1 at Mtw1-C; mean ± s.e.m.; n = 61, 49, 19, 42 cells were analyzed (from left to right). Data were pooled from 2 independent experiments. n. s. – not significant, p-value > 0.05 using Mann-Whitney test).
(c) Left: Fractional intensity distributions of Mps1-Frb-GFP (that autonomously localizes along the spindle in the absence of rapamycin) and Ndc80-GFP along the spindle in cells arrested in metaphase using CDC20 repression (spindle pole bodies visualized using Spc97-mCherry). Error bars represent s.e.m. from n = 38 and 57 cells for Mps1 and Ndc80, respectively. The experiment was repeated twice and graph presents mean data pooled from 2 independent experiments. Right: Bub3 and Mad1 do not localize to kinetochores under the same conditions. Mad1 puncta correspond to its known localization to the nuclear envelope62. Scale bar ~ 3 μm.