
Figure 4. The Dam1 complex defines a boundary for SAC signaling by anchored Mps1.
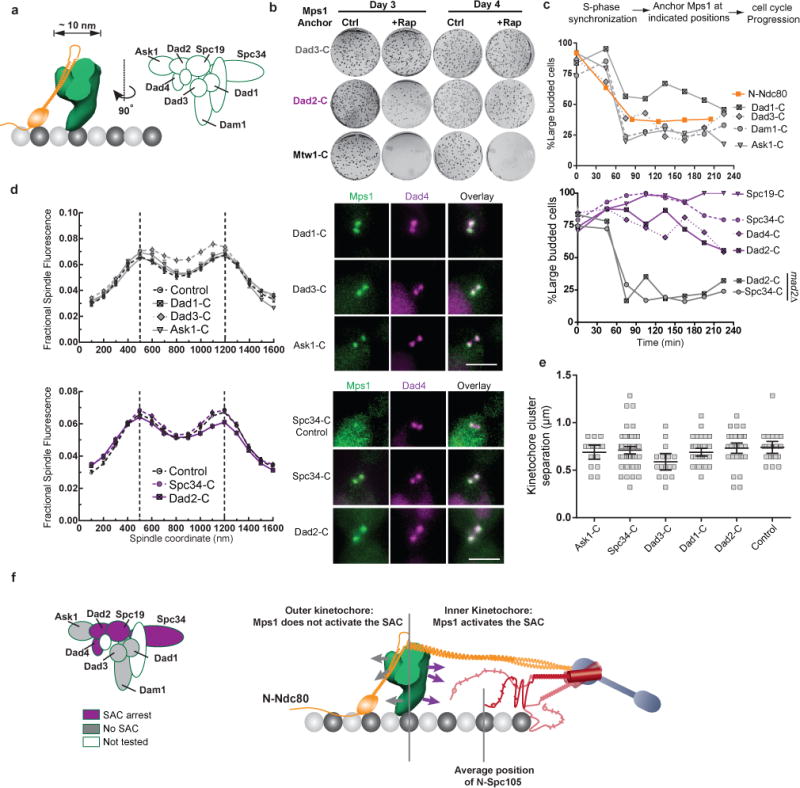
(a) Cartoon: Position of the Dam1 complex relative to Ndc80 complex23 and subunit organization within the Dam1 complex27. EMD1372 was used to infer the dimensions of the Dam1 complex.
(b) Colony growth (also see Supplementary Fig. 4a) on control (ctrl.) and rapamycin (+Rap) plates. The number of days after plating is indicated at the top; the anchoring subunit is indicated on the left.
(c) Cell cycle progression when Mps1 is anchored to a Dam1 subunit (indicated on the left) in cells released from an experimentally imposed S-phase arrest. This strategy was used to ensure that the kinetochores formed end-on attachments and loaded Dam1 complex before Mps1 was anchored 42. Plotted points represent the average values calculated from 2 independent experiments. The source data are shown in Supplementary Table 3.
(d) Normalized distribution of Dad4-mcherry on the spindle when Mps1 was anchored to the indicated positions for 1 hour (mean ± s.e.m. n = 43, 34, 28, 36, 73 and 38 cells for Dad1, Dad3, Ask1, Ctrl, Spc34 and Dad2, respectively). Control data is from untreated metaphase cells. Micrographs on the right display the localization of Dad4-mCherry relative to that of Mps1-frb-gfp anchored to the indicated subunits (scale bar ~ 3 μm).
(e) The separation between kinetochore clusters in the cells in (d), measured as the separation between maximum intensity pixels in the two Dad4-mCherry puncta in each cell; mean ± 95% confidence interval, n = 43, 16, 16, 25, 72 and 38 cells for Dad1, Dad3, Ask1, Ctrl, Spc34 and Dad2, respectively. Although there is a small decrease in spindle length when Mps1 is anchored at Dad3-C, cell cycle progression is unaffected as seen in (c).
(f) Left: Classification of Dam1 complex subunits inferred from the Mps1 anchoring experiments. Right: Activity map of the anchored Mps1 along the length of the kinetochore-microtubule attachment. Arrows from the Dam1 complex depict the proposed orientation of the C-termini of subunits used as anchors. Possible variations in the conformation of the unstructured phosphodomain of Spc105 are also depicted.