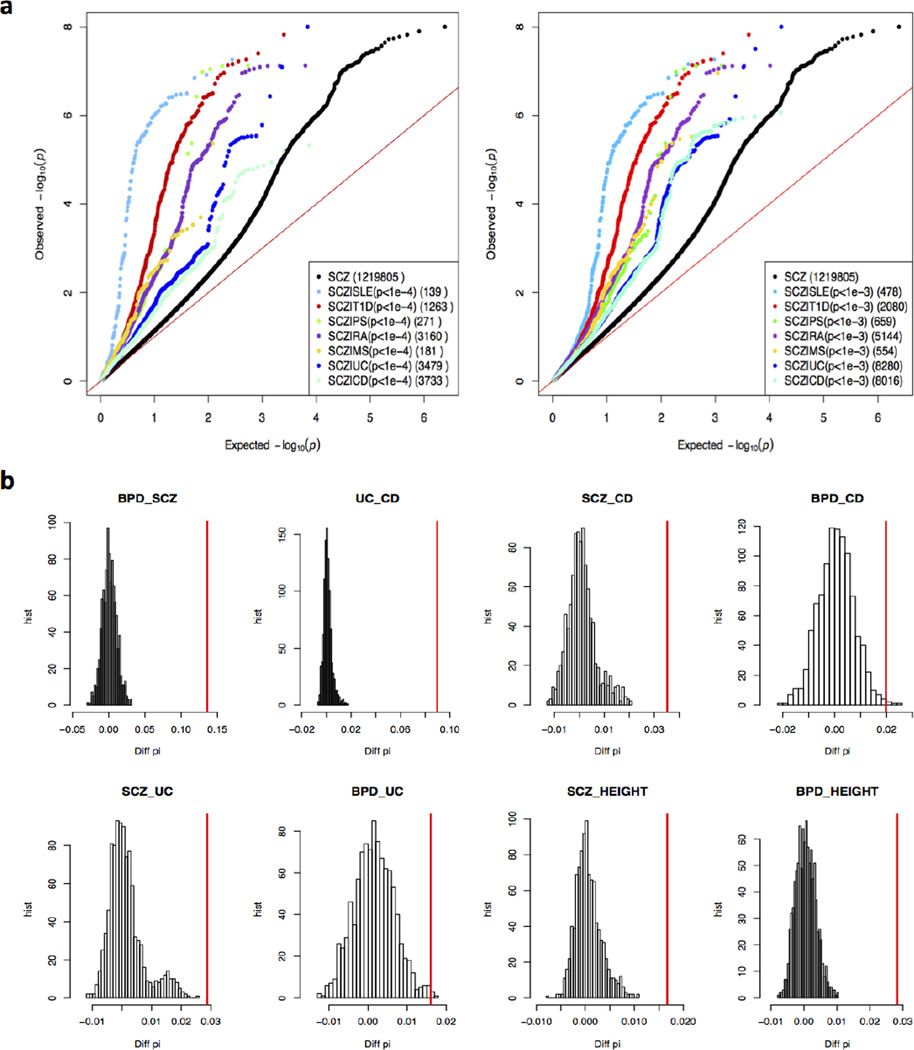
Fig. 1. Pervasive pleiotropic effects between psychiatric and immune system disorders.
a) Conditional Q-Q plot showing pleiotropy between schizophrenia and 7 immune system disorders. Black dots represent all 1 219 805 SCZ GWAS SNPs while the other 7 colored dots represent different subsets of SNPs selected from the corresponding immune system disorder GWAS whose p < 0.0001 (left panel) and p < 0.001 (right panel), with the number of SNPs in each subset shown in brackets. (b) Chromosome-bound circular permutation to adjust LD effects for assessment of the significance of pleiotropy of eight GWAS pairs. For each of the 8 trait-pairs, 1000 times of chromosome-bound circular permutations were performed. The distribution of the test-statistic from 1,000 permutations are shown by histograms, where x-axis represents the test-statistic, Diff_PI = π̂11 − (π̂10 + π̂11)(π̂01 +π̂11) , and y-axis represents its frequency. Red vertical line denotes the observed test statistics for each trait-pair.

