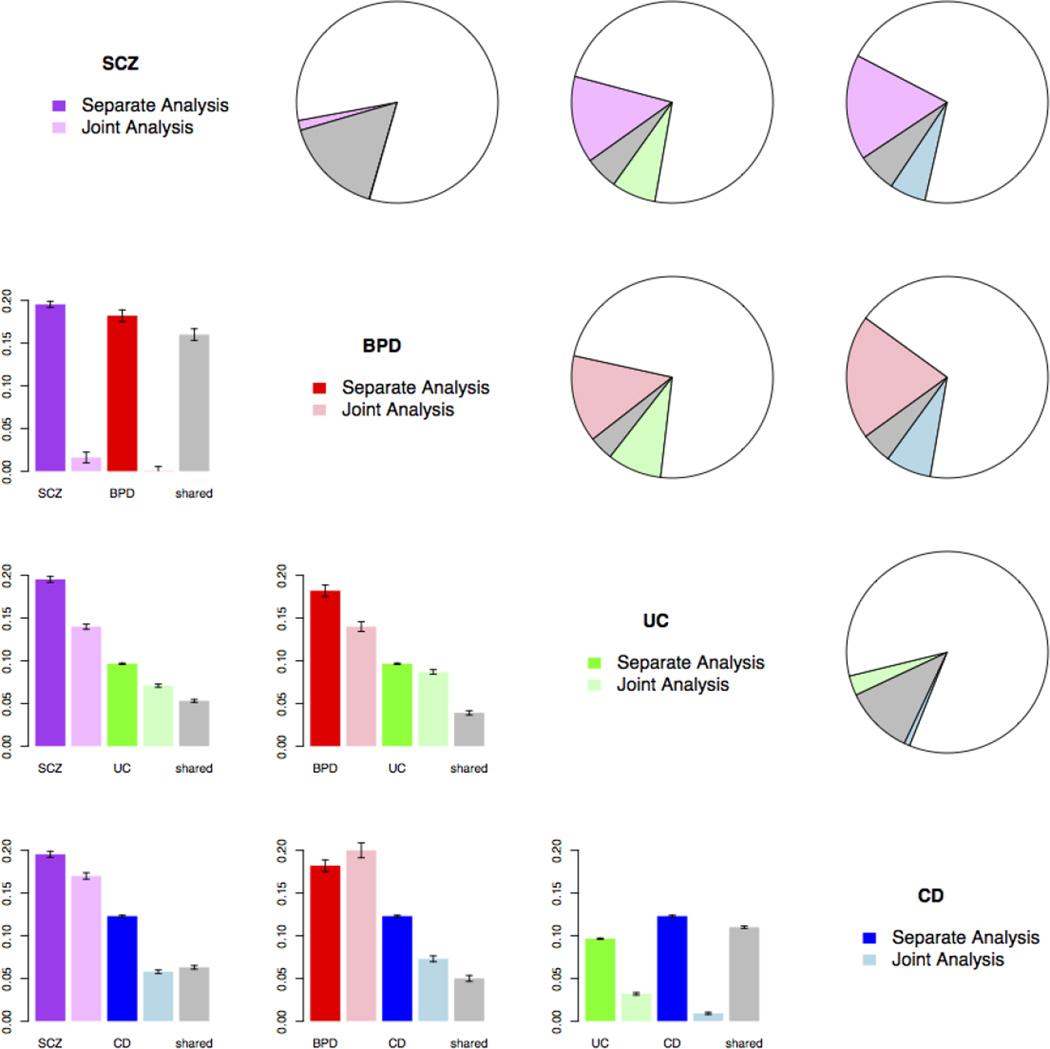
Fig. 2. GPA results showing pleiotropic effects among SCZ, BPD, UC and CD.
Purple, red, green and blue represent SCZ, BPD, UC and CD; grey represents the proportion of SNPs associated with both disorders, and white represents the proportion of SNPs associated with neither disorder. Upper triangle: pie charts show proportion of SNPs associated with only one disorder, both disorders (grey), and neither disorder (white). Lower triangle: bar plots contrasting proportions of associated SNPs for each disorder when analyzed separately (first and third bar in darker color), and proportion of associated SNPs when two disorders are jointly analyzed (second and fourth bar for proportion of SNPs associated with only one disorder, and fifth grey bar for proportion of SNPs associated with both disorders). Error bars indicate one standard error.

