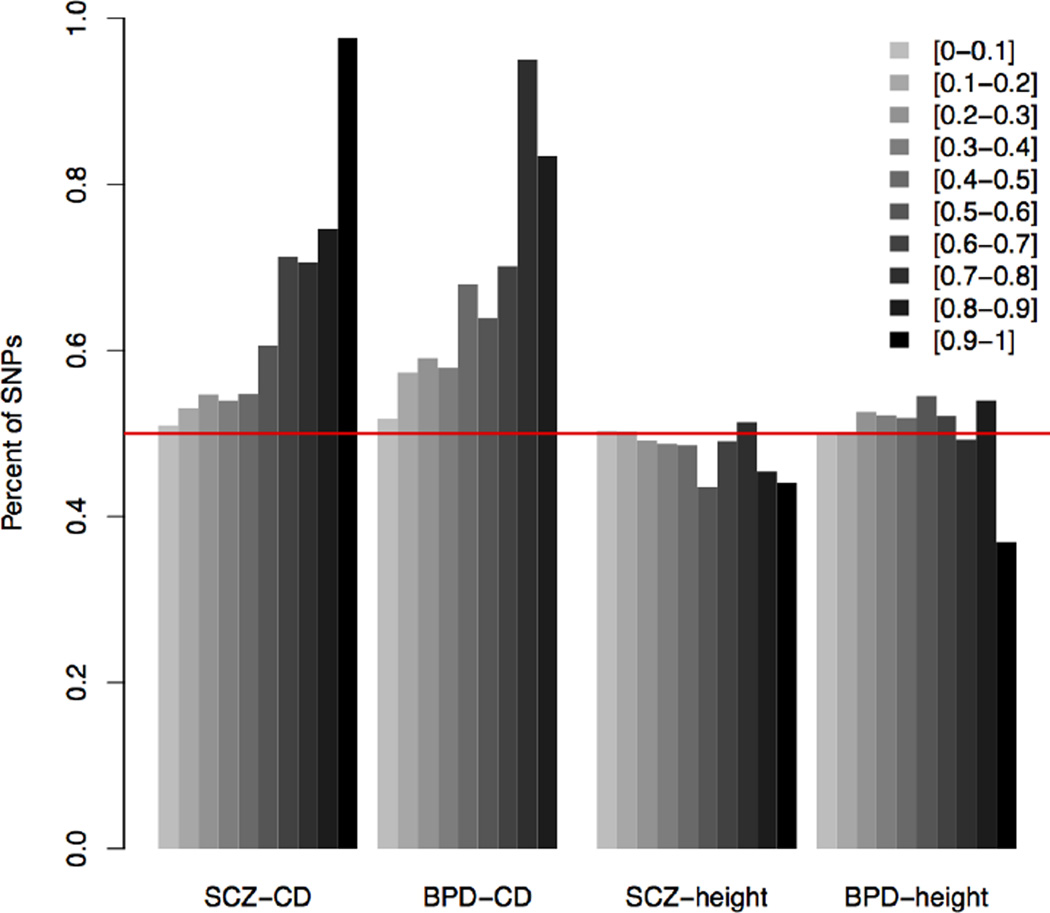
Fig. 4. Trend of consistent effect directions for SCZ/BPD-CD across posterior probability groups.
Proportion of SNPs having the same effect direction for trait pairs, in each of the 10 posterior probability groups (darker colors indicate higher posterior probability), where SNPs were grouped based on posterior of being associated with both traits into 10 equal bins. Four pairs of traits: SCZ-CD, SCZ-height, BPD-CD, and BPD-height.

