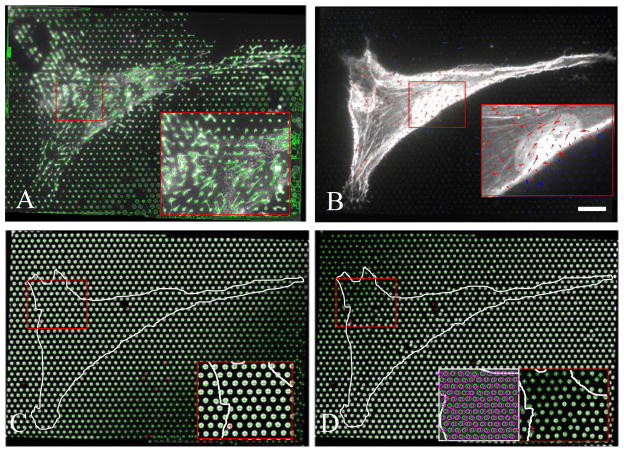
Figure 2. Representative output images from microfabricated pillar arrays (MPAs).
(A) Fibronectin immuno-fluorescence image shows assembled fibrils extending from fibronectin-stamped pillars. (B) Traction forces are represented by arrows; pillar deflections beneath cell (red arrows) are significantly larger than pillars not contacted by the cell (blue arrows). (C) Image of the base of the pillars indicates undeflected positions, whereas (D) image of the free end of the pillars indicates the deflected positions. Inset shows overlay of top and bottom images; difference in centroid indicates pillar deflection. Scale bar = 20 microns.

