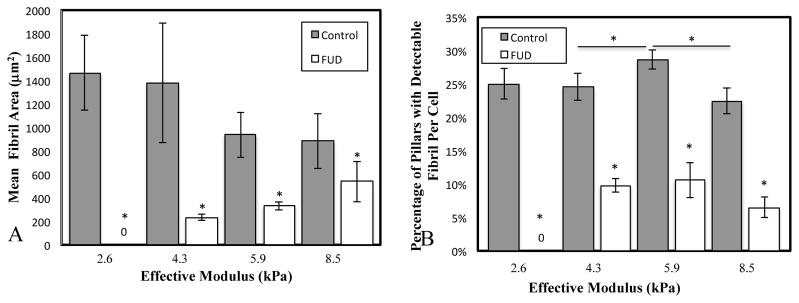
Figure 3. FN fibrillogenesis as a function of substrate stiffness.

Cells were grown on MPAs of varying stiffness, and the resulting FN fibrillogenesis was quantified via two metrics: A) the mean fibril area per MPA pillar per cell, and B) the percentage of pillars that contained a detectable fibril. *p < .05, N > 10 cells for each condition.
