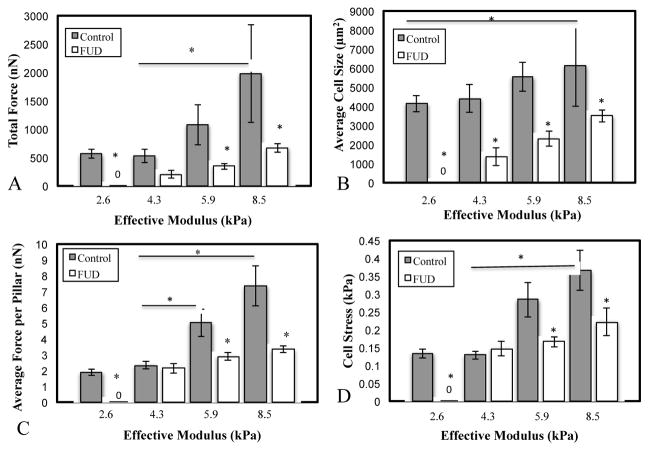
Figure 4. Quantification of cell traction forces and cell size as a function of stiffness and FN fibrillogenesis.
Cells were plated onto MPAs of varying stiffness and exhibited (A) an increase in total cell force and (B) a small but insignificant increase in cell size as a function of stiffness. Treatment with the FN fibrillogenesis inhibitor FUD significantly reduced both. To assess whether force changes were simply a function of impaired spreading, two normalized metrics were used: C) the average force per pillar per cell and D) the cell stress (force per unit cell area). In both metrics, FUD treatment showed significant inhibition of the normalized force on stiffer surfaces. *p < .05. N > 10 cells per condition.

