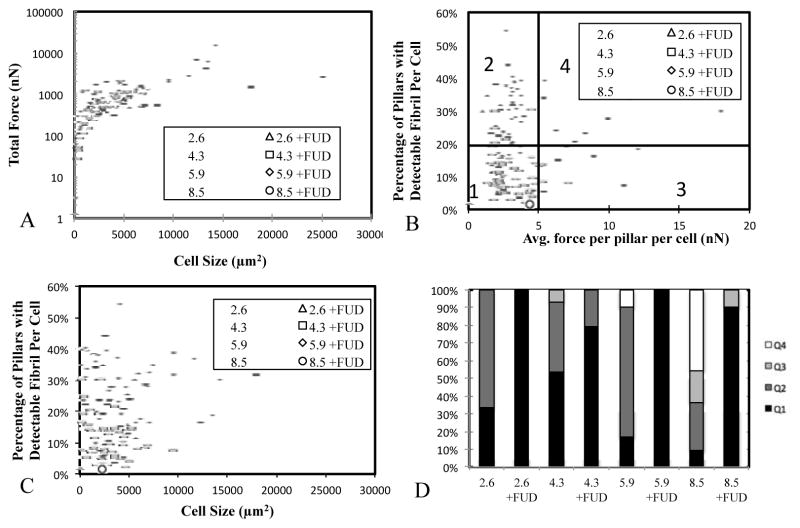
Figure 8. Relationship between force, cell area, and FN fibrillogenesis.
(A) Total cell force and cell size can be related be a power law function regardless of stiffness or FUD treatment; treatment with FUD shifts the relationship to lower values. (B) Fibril/force relationship was divided into quadrants and suggest an optimal force for FN fibrillogenesis. (C) Fibrillogenesis shows no correlation with cell size. (D) Quantification of quadrants indicates a predominance of cells in Q2 on intermediate stiffnesses. FUD treatment leads to a predominance of Q1 cells.

