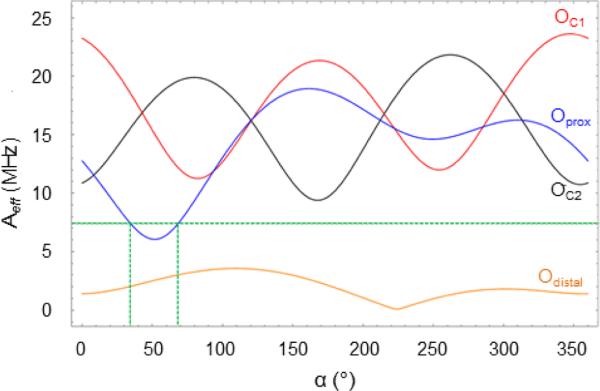
Figure 10.
Aeff vs α calculated for OC1 and OC2 of the HPCA substrate, and Oproximal and proton carrying Odistal of the hydroperoxo ligand. The green dashed line indicates the experimentally determined upper limit for Aeff for the hydroperoxo oxygens. The plot was prepared using β = 70°. The DFT-calculated principal components of A(17Oproximal) are [−5.8, −16.2, −21.0] MHz. Angles α and β position z’ of the EFG in the x,y,z frame of the ZFS tensor. Figure S8 shows the direction of the unique axis relative to the DFT structure.

