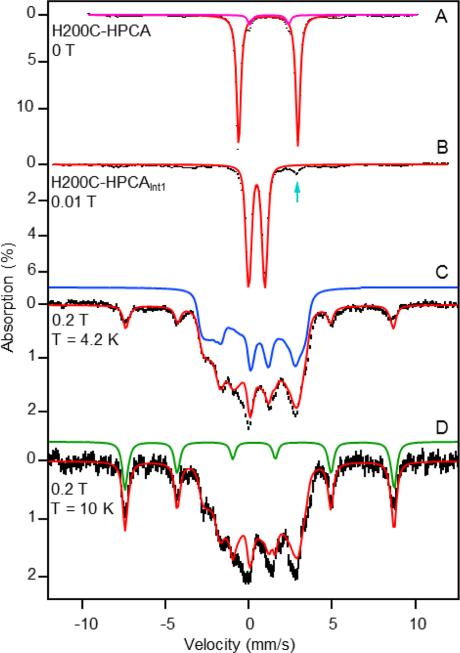
Figure 3.
(A) Zero-field, 4.2 K Mössbauer spectrum (black) of H200C-HPCA (simulation, red curve) and the minority species with ΔEQ = 2.32 mm/s and δ = 1.20 mm/s (magenta curve). The spectra shown in panels A and B are raw data. Spectra shown in panels C and D were obtained by removing the high-spin ferric and high-spin ferrous impurities. (B, C) Spectra of the oxygenated intermediate, H200C-HPCAInt1 = Int1, recorded at 4.2 K in parallel applied magnetic fields as indicated. The arrow in (B) points at the high-energy line of a doublet attributed to resting enzyme. (D) B = 0.2 T spectrum recorded at 10 K. The spectra in (C) and (D) contain a 6-line pattern (green curve) associated with the excited MS = ±2 doublet of the S = 2 multiplet. The absorption of this feature increases with increasing temperature, showing that D > 0. The dominant contributions of the central feature, blue in (C), are from the MS = 0 state and MS = ± 1 doublet.

