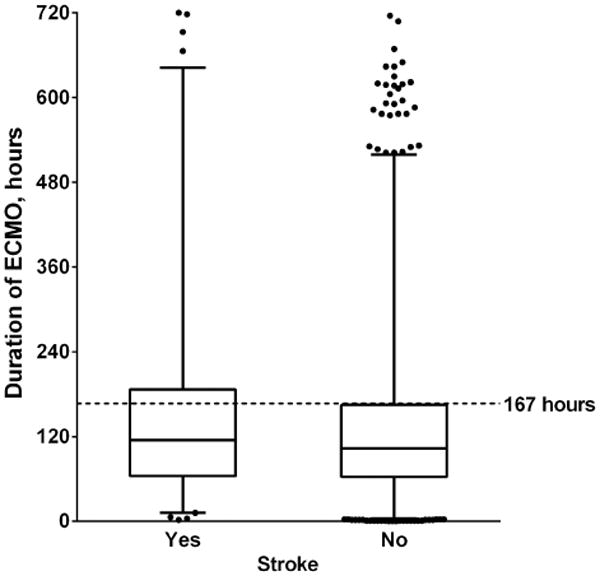
Figure 2.

ECMO duration in patients with and without stroke. The middle line represents the median ECMO duration in each group; the bottom and top of the box represent the 25th and 75th percentiles, respectively; the whiskers represent the 1st and 99th percentiles. Scattered points represent outliers. The dotted line represents the 75th percentile for ECMO duration in the entire cohort (167 hours).
