
Figure 8.
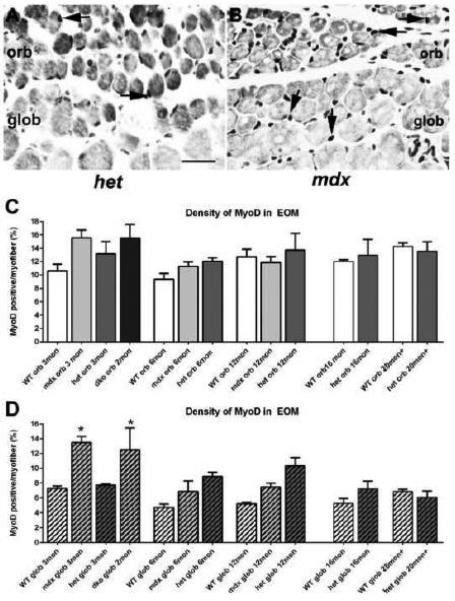
: MyoD-Positive Cell Density in the EOM of WT, mdx, mdx:utrophin+/−, and mdx:utrophin−/− Mice. A. EOM from an mdx:utrophin+/− (het) mouse immunostained for the expression of MyoD, with two positive nuclei in the orbital layer indicated by the black arrows. B. EOM from an mdx mouse immunostained for the expression of MyoD, with two positive nuclei in the orbital layer and two positive nuclei in the global layer indicated by the black arrows. Bar is 20μm. C. Quantification of MyoD-positive cell density in the orbital layer of WT, mdx, mdx:utrophin+/−, and mdx:utrophin−/− (dko) at indicated intervals showed that there was no significant difference in the density of MyoD-positive cells in any of the genotypes at any of the ages examined. D. Quantification of MyoD-positive cell density in the global layer of WT, mdx, mdx:utrophin+/−, and mdx:utrophin−/− at indicated intervals showed a significant increase in density of MyoD-positive nuclei in the mdx andmdx:utrophin−/− EOM compared to WT control global layer. No other significant differences were seen. Data are expressed as mean ± SEM. * indicates significant difference from age-matched WT control.