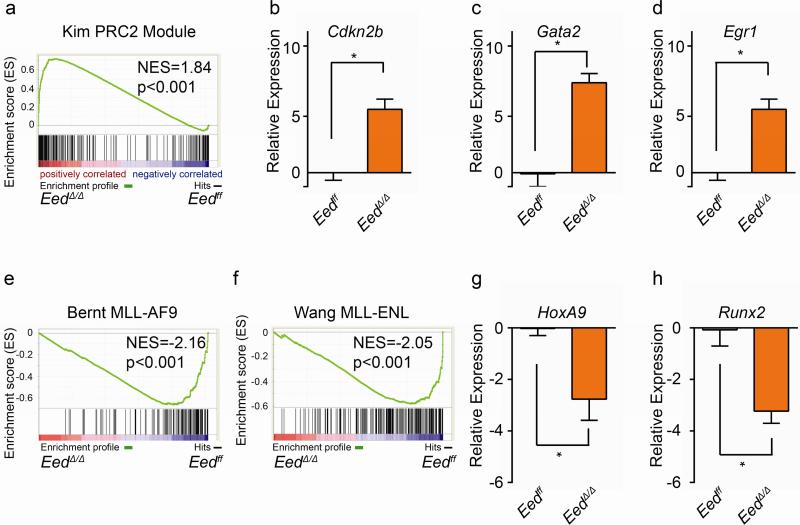
Fig. 3. Transcriptional changes in response to Eed-inactivation.
a) Polycomb Repressive Complex 2 (PRC2) binding targets are enriched in MLL-AF9/EedΔ/Δ/Cdkn2ako cells compared to MLL-AF9/Eedff/Cdkn2ako cells. b)-d) Increased expression as measured by RT-qPCR of PRC2 binding targets Cdkn2b (b), Gata2 (c) and Egr1 (d) in MLL-AF9/EedΔ/Δ/Cdkn2ako clones. (n=2, Eedff and n=4 for Eedko). e) Negative enrichment (i.e. decreased expression) of MLL-AF9 fusion binding targets in MLL-AF9/EedΔ/Δ/Cdkn2ako cells. d) Negative enrichment (i.e. decreased expression) of MLL-ENL fusion binding targets in MLL-AF9/EedΔ/Δ/Cdkn2ako cells. g) Decreased expression of HoxA9 in MLL-AF9/EedΔ/Δ/Cdkn2ako clones (Eedff, n=2, and EedΔ/Δ n=4). h) Decreased expression of MLL-AF9 binding target Runx2 in MLL-AF9/EedΔ/Δ/Cdkn2ako clones (Eedff, n=2, and Eedko n=3). Relative expression values are expressed as log2 of MLL-AF9/EedΔ/Δ/Cdkn2ako compared to MLL-AF9/Eedff/Cdkn2ako. *p<0.05.

