
Figure 4.
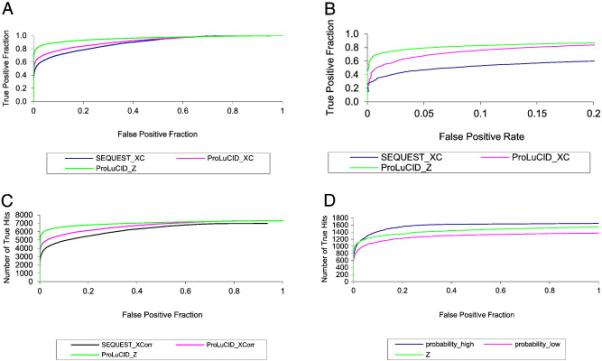
ROC curves of ProLuCID and SEQUEST scores. A. Typical ROC curves of SEQUEST XCorr, ProLuCID XCorr and ProLuCID Z score. B. Modified ROC curves, showing true positive fraction as a function of false positive rate. C. Plots of number of true hits against false positive fraction of SEQUEST XCorr, ProLuCID XCorr and ProLuCID Z score. D. Plots of number of true hits against false positive fraction of ProLuCID high mass accuracy probability score, low mass accuracy probability score and Z score.