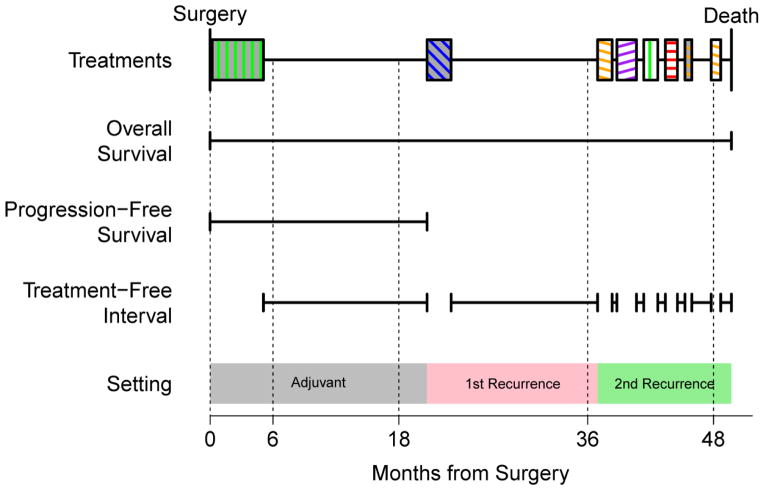
Figure 1.
Schematic of a typical patient chemotherapy timeline. Overall survival spans the interval from surgery on the left to death on the right. Progression free survival is the time from surgery to the start of the first non-adjuvant chemotherapy. Chemotherapy regimens are filled blocks with colors encoding the type of chemotherapy (see Figure 2 for legend) and treatment free intervals are the spans in between them. We infer an increment in serial recurrences when a gap of longer than 30 days appears.

