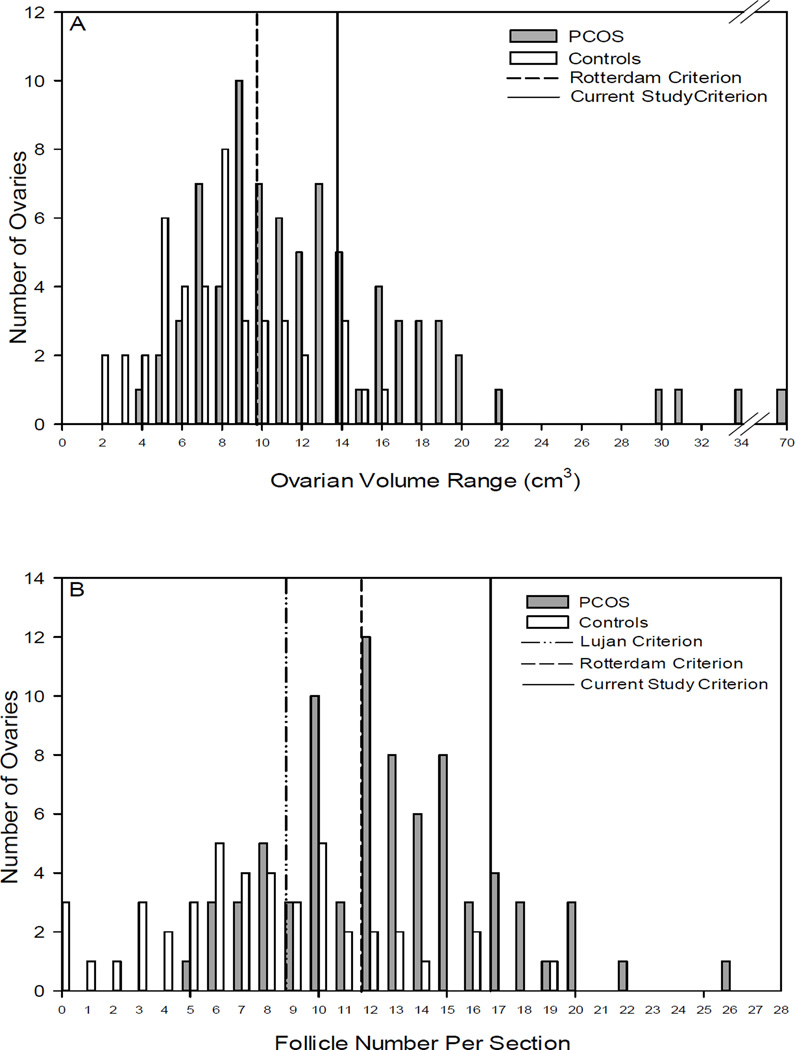
Figure 2.
Range of OV and FNPS by MRI in adolescents with PCOS versus controls without PCOS. Figure 2A shows the distribution of OV in subjects with PCOS and controls. The vertical dashed line delineates polycystic OV (>10cm3) from normal OV (≤10cm3) as per Rotterdam criteria and the solid line delineates polycystic OV (>14cm3) from normal OV (≤14cm3) as per the cut off calculated in this study (Kenigsberg et al.). Figure 2B shows the distribution of FNPS in subjects with PCOS and controls. The vertical dashed line delineates FNPS characterizing a polycystic ovary (≥12) versus normal (<12) per Rotterdam criteria, the dash/dot line per Lujan et al. criteria, and the solid line per the cut off calculated in this study (Kenigsberg et al.): polycystic ovary (≥17) versus normal (<17) .

