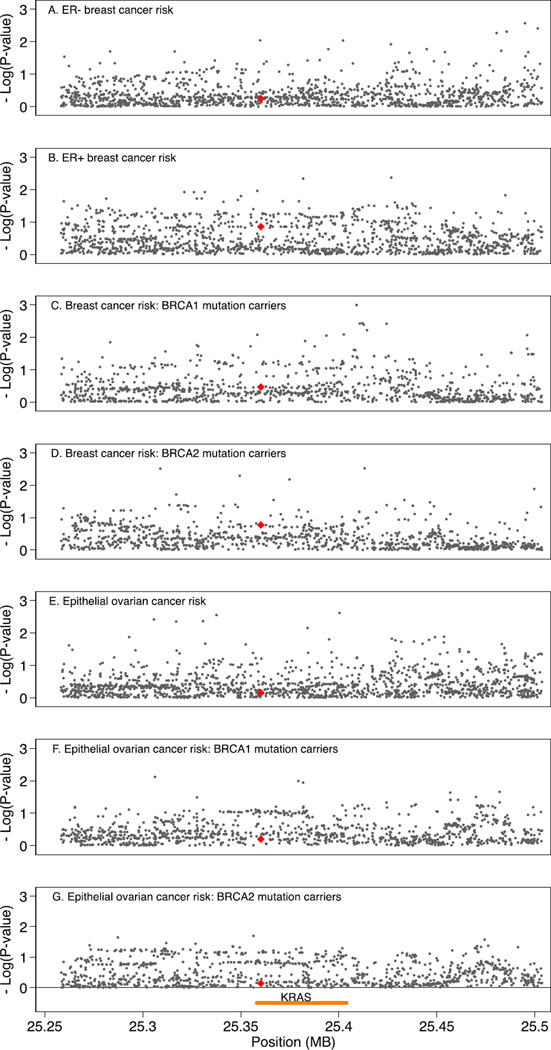
Fig. 1.
Regional association plots for variants within the genomic region 100 kb either side of KRAS and risk of ovarian and breast cancer. X-axis position is referent to position (bp) on chromosome 12, build GRCh37.p12; yellow line indicates position of KRAS; red triangle indicates rs61764370. Y-axis is — log10(p-values) from association tests for risk of A) ER-negative breast cancer, B) ER-positive breast cancer, C) breast cancer in BRCA1 mutation carriers, D) breast cancer in BRCA2 mutation carriers, E) epithelial ovarian cancer, F) epithelial ovarian cancer in BRCA1 mutation carriers, and G) epithelial ovarian cancer in BRCA2 mutation carriers. (For interpretation of the references to color in this figure legend, the reader is referred to the web version of this article.)

