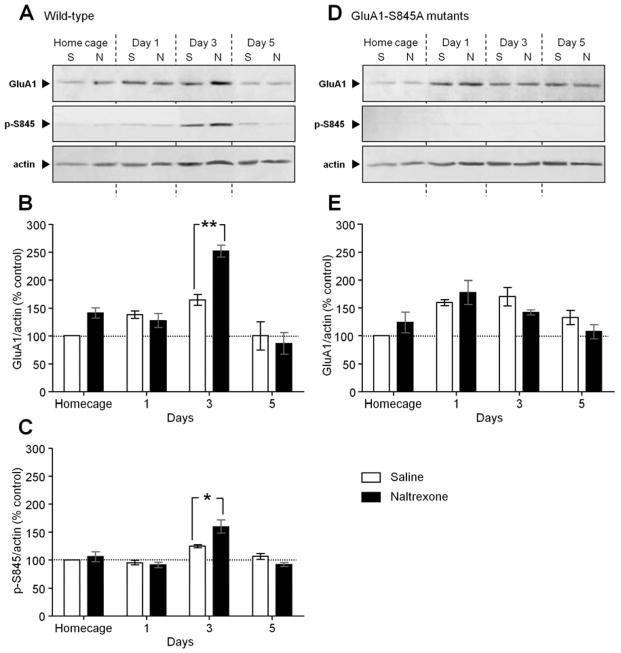
Figure 5.
Chronic naltrexone treatment significantly increased GluA1 expression and GluA1-S845 phosphorylation during the third day of acquisition in the wild-type mice, but not in GluA1-S845A mutant mice. Bars and errors are means means ± SEMs. (A) Western blot analysis showing the difference between saline (S) and naltrexone (N) chronic treatment on the level of GluA1, phosphorylated GluA1-S845 (p-S845) and actin at the PSD of hippocampi extracted from wild-type mice (n = 6/group) in their home cage, and on different days of acquisition (Home cage, Day 1, Day 3, Day 5). (B, C) Densitometric quantifications of Western blots in (A). On the histograms, the ratios GluA1/actin (B) and p-S845/actin (C) are normalized to the saline-treated home cage group. (D) Western blot analysis showing the difference between saline (S) and naltrexone (N) chronic treatment in the level of GluA1, phosphorylated GluA1-S845 (p-S845) and actin at the PSD of hippocampi extracted from GluA1-S845A mutant mice (n = 6/group) in their home cage and on different days of acquisition (Home cage, Day 1, Day 3, Day 5). The Western blots confirmed the absence of phosphorylated GluA1-S845 staining in GluA1-S845A mutant mice. (E) Densitometric quantifications of Western blots in (D). On the histograms, the ratio GluA1/actin (E) is normalized to the saline-treated home cage group. Significant differences between saline- and naltrexone-treated mice were determined using two-way ANOVAs, followed by Newman-Keuls’s post hoc comparisons. * p < .05 and ** p < .01 significant differences between saline- and naltrexone-treated mice.

