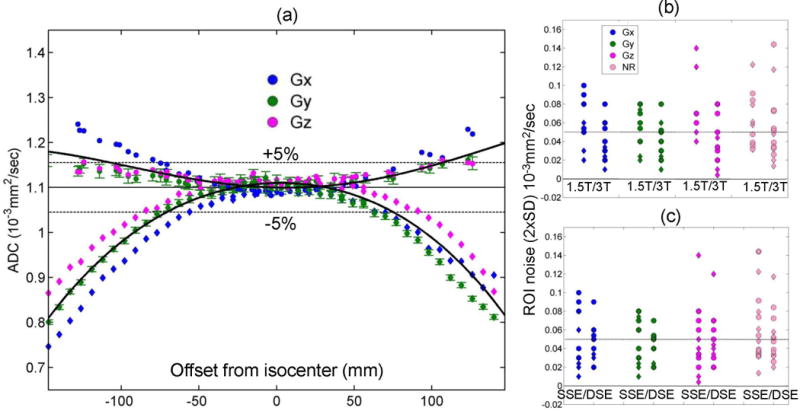
Figure 1.

(a) The measured ADC of water at 0°C is plotted for the individual diffusion gradient channels (GX: blue, GY: green, GZ: magenta) of one representative MRI scanner as a function of the offset from isocenter along the RL (circles) and the SI (rhombi) phantom orientation; the average (trace) ADC for the three channels is also shown (solid black curves). The known (unbiased) ice-water ADC value (solid line) ±5% deviation (dashed lines) is shown for reference. Error bars (illustrated only for GY (green) channel for clarity) represent one standard deviation (SD) of measurement noise within each ROI. The 2×SD noise averaged over all offsets is shown on the same scale as the norm of residuals (NR, pink symbols) of the trace-ADC fit for both acquisition orientations (RL: circles, SI: rhombi) of each gradient channel (legend) versus field strength (b) and sequence variant (c). Dotted horizontal lines in (b) and (c) mark mean ADC noise level across systems.
