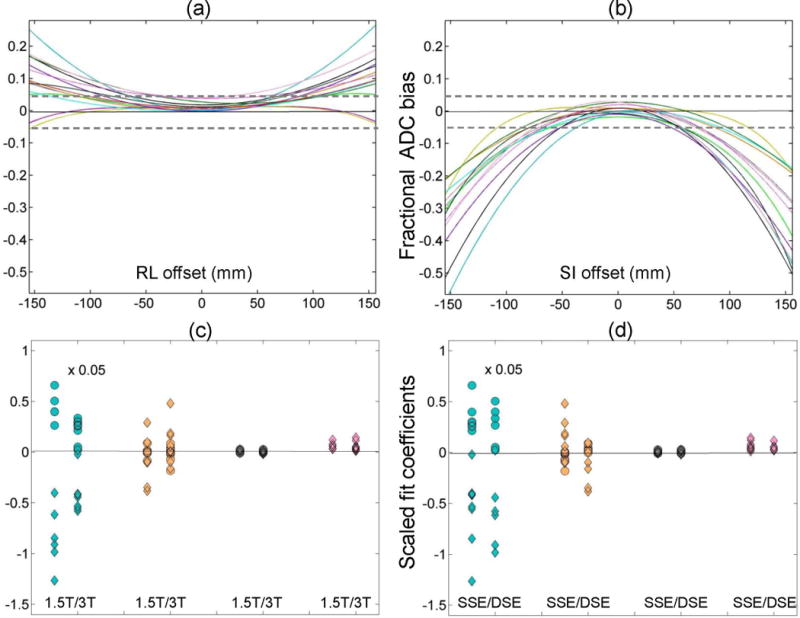
Figure 3.

Fractional trace-fit ADC bias for the ice-water phantom is plotted for all measured systems (Table 1) as a function of RL offset (a) and SI offset (b). Dashed horizontal lines mark ±5% error. The corresponding scaled fit coefficients (left-to-right: quadratic, linear and constant) and the fitted norm of residuals are plotted as a function of field (c) and sequence variant (d) for the RL orientation (circles) and SI orientation (rhombi). Note that the linear and quadratic fit coefficients are scaled by 10−3 and 10−6, respectively, for uniform presentation (as described in Methods). Additional scaling by 0.05 was applied to quadratic coefficient to aid visualization.
