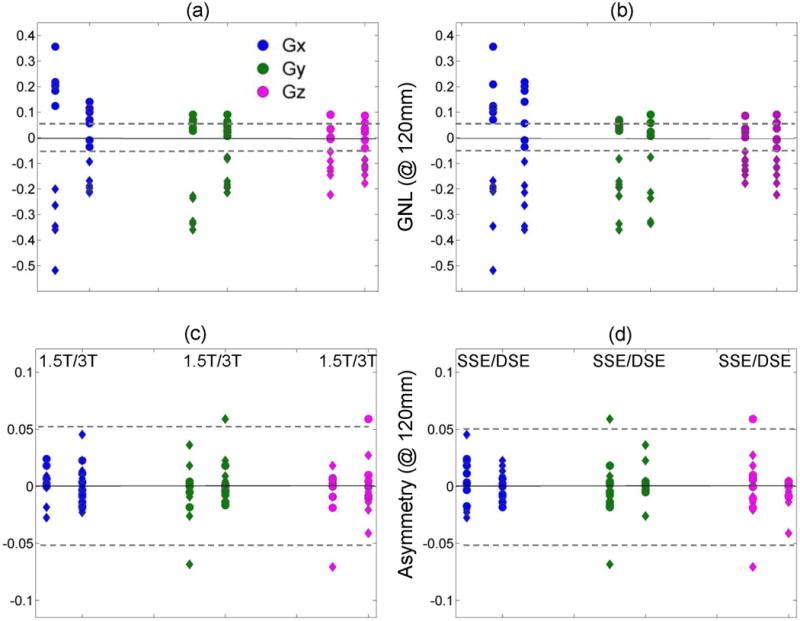
Figure 4.

The channel-specific (GX: blue, GY: green, GZ: magenta) fractional gradient nonlinearity (GNL) bias and average bias asymmetry error measured at ±120 mm are plotted versus field strength (a and c, respectively) and sequence variant (b and d, respectively). Data are shown for all 14 MRI scanners along the RL orientation (circles), as well as, for available (Table 1) 13 and 12 scanners along SI (rhombi) for GNL and asymmetry, respectively. The dashed horizontal lines mark ±0.05 bias error.
