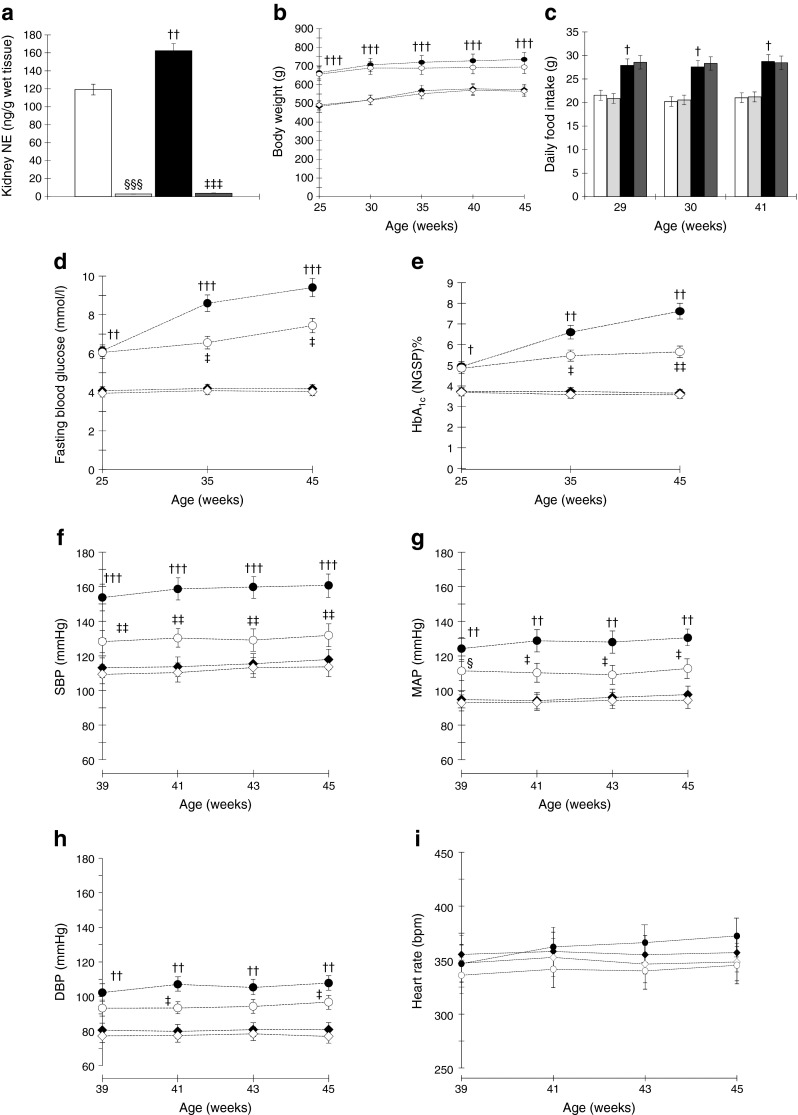
Fig. 1.

(a) OLETF rats show significantly higher kidney tissue NE levels compared with LETO rats. Kidney tissue NE levels in OLETF rats subjected to RDX are almost undetectable. (b, c) OLETF rats show higher body weight (b) and daily average food intake (c) compared with LETO rats, which were not affected by RDX. (d, e) OLETF rats show markedly elevated fasting blood glucose (d) and HbA1c (e) levels compared with LETO rats, which are suppressed by RDX. (To convert values for HbA1c in DCCT % into mmol/mol, subtract 2.15 and multiply by 10.929.) (f–h) OLETF rats show markedly increased SBP (f), MAP (g) and DBP (h) compared with LETO rats. RDX suppresses SBP, MAP and DBP in OLETF rats. However, heart rate was not different among the groups (i). † p < 0.05, †† p < 0.01, ††† p < 0.005 LETO vs OLETF; ‡ p < 0.05, ‡‡ p < 0.01, ‡‡‡ p < 0.005 OLETF vs OLETF+RDX; § p < 0.05 LETO vs LETO+RDX; §§§ p < 0.005 LETO vs LETO+RDX. White bars and white diamonds, LETO group; black bars and black circles, OLETF group; light grey bars and black diamonds, LETO+RDX; dark grey bars and white circles, OLETF+RDX
