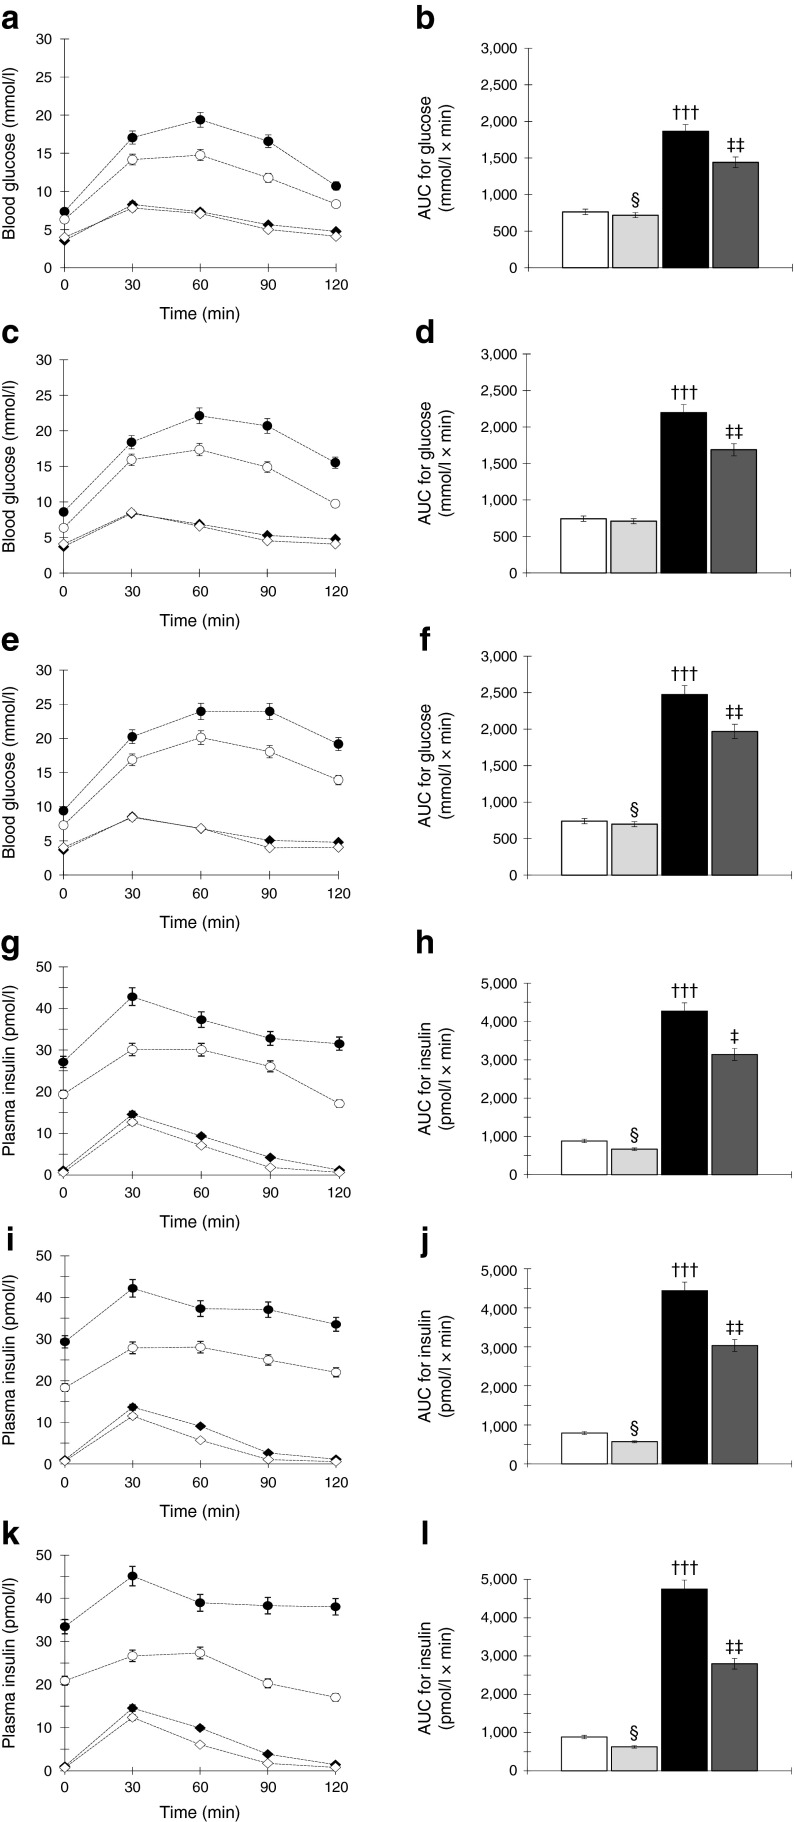
Fig. 2.
(a–f) Blood glucose levels and their respective AUCs at 30 (a, b), 35 (c, d) and 45 (e, f) weeks of age during OGTT. OLETF rats show higher glucose levels and AUCs, which are suppressed by RDX. (g–l) Plasma insulin levels and their AUC at 30 (g, h), 35 (i, j) and 45 (k, l) weeks of age. OLETF rats show higher plasma insulin levels and AUC, which were suppressed by RDX. ††† p < 0.005 LETO vs OLETF; ‡ p < 0.05, ‡‡ p < 0.01, OLETF vs OLETF+RDX; § p < 0.05, LETO vs LETO+RDX. White bars and white diamonds, LETO group; black bars and black circles, OLETF group; light grey bars and black diamonds, LETO+RDX; dark grey bars and white circles, OLETF+RDX

