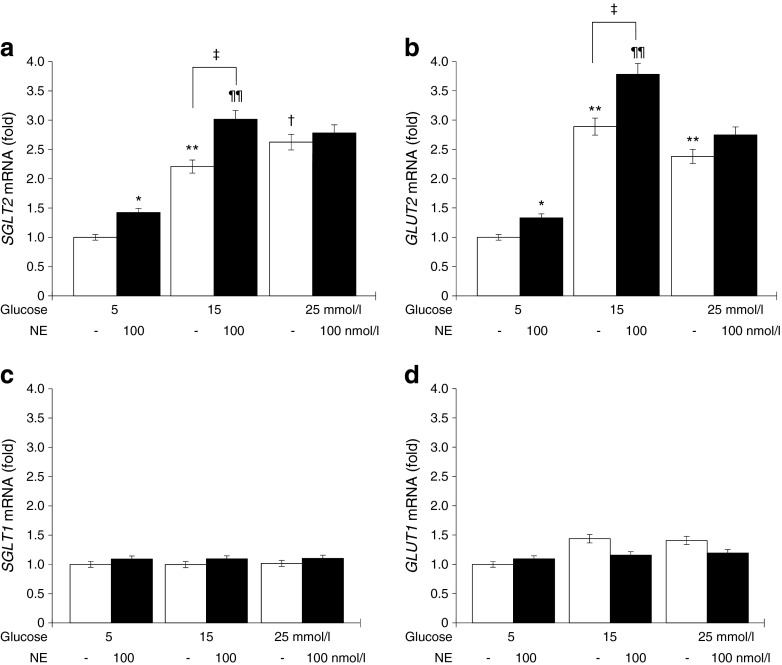
Fig. 6.
(a) Treatment with high glucose for 12 h upregulated SGLT2 mRNA expression, which was further enhanced by exposure to NE in HK2 human kidney proximal tubule epithelial cells. (b) GLUT2 mRNA expression was also upregulated by high glucose treatment, and was further enhanced by exposure to NE. (c, d) In contrast, SGLT1 (c) and GLUT1 (d) mRNA expression remained unaltered after high glucose and/or high glucose plus NE treatment. Data are expressed as the relative difference in expression compared with 5 mmol/l glucose after normalisation for β-actin expression. *p < 0.05, **p < 0.01 vs 5 mmol/l glucose; ¶¶ p < 0.01 vs 5 mmol/l glucose + NE; † p < 0.05 vs 15 mmol/l glucose. ‡ p < 0.05, as indicated

