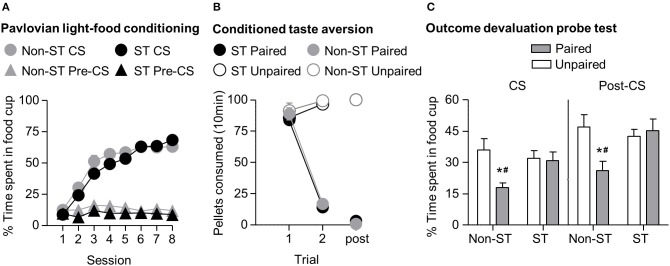
Figure 4.

Experiment 1: Phase I–III: Performance during Pavlovian light-food conditioning, conditioned taste aversion and outcome devaluation probe test separated by tracking tendency. (A) Phase I: Light-food conditioning separated by between subjects factor Tracking tendency: sign-tracking (n = 36) vs. non-sign-tracking (n = 21). Percent time spent in food cup (mean ± SEM) during the last 5 s of the 10 s Pre-CS and CS period of light-food conditioning. (B) Phase II: Pellet consumption during conditioned taste aversion training and post-probe homecage consumption test. Number of pellets consumed (mean ± SEM) in 10 min conditioned taste aversion training sessions (trial 1 and 2) and during post-probe homecage consumption test session (post). Paired or Unpaired data is separated by the later determined between subjects factor of tracking tendency. (C) Phase III: Overall effect of outcome devaluation during probe test. Percent time spent in food cup (mean ± SEM) during outcome devaluation probe test separated by tracking tendency during CS (left) and post-CS (right) for Unpaired and Paired groups. *Different percent time spent in food cup between Unpaired and Paired groups within tracking tendency, p < 0.05. Paired non-sign-tracking (n = 12); Paired sign-tracking (n = 16) vs. Unpaired non-sign-tracking (n = 9); Unpaired sign-tracking (n = 20). #Different in % time spent in food cup between Paired sign-trackers and Paired non-sign-trackers groups, p = 0.05.
