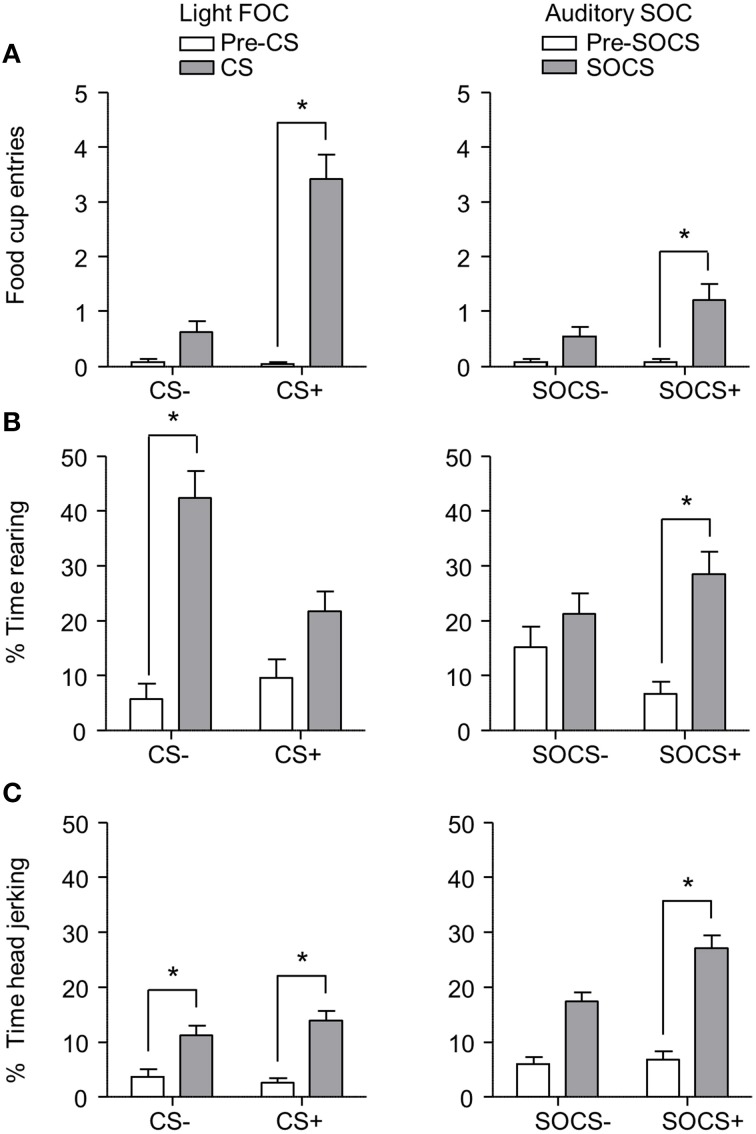
Figure 6.
Exp 2: Phase III: Overall performance during second-order probe test. (A) Number of food cup entries (mean ± SEM) during the last 5 s of the 10 s Pre-CS and CS for the light first-order cue (FOC; CS+, or CS−; left panel) and auditory second-order cues (SOC; SOCS+ or SOCS−; right panel). (B) Percent time spent rearing (mean ± SEM) during the first 5 s of the 10 s Pre-CS and CS for the light first-order cues (FOC; CS+ or CS−; left panel) and the total 10 s for the auditory second-order cues (SOC; SOCS+ or SOCS−; right panel). (C) Percent time spent head jerking (mean ± SEM) during the total 10 s Pre-CS and CS for the light first-order cues (FOC; CS+ or CS−; left panel) and the total 10 s for the auditory second-order cues (SOC; SOCS+ or SOCS−; right panel). *Different in responding between pre-CS and CS, p < 0.05.

