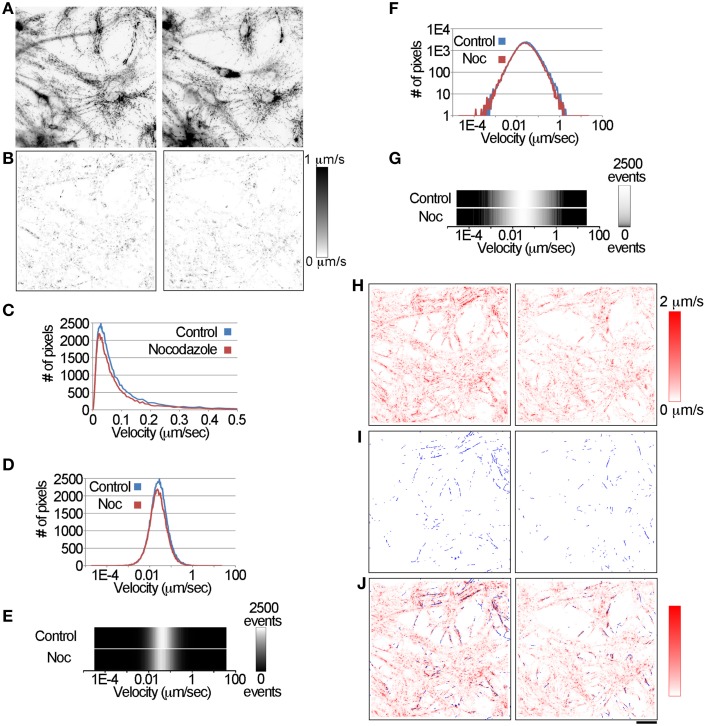
Figure 3.
Using the LKMTA and DTA to measure the reduction in fast mitochondrial transport in a single pair of pre-drug/post-nocodazole movies. (A) A set of images from a single well, before and after application of nocodazole. (B) The absolute velocity maps for the control and nocodazole treated samples at a single time point. The bar to the side shows the scaling between pixel intensity and local velocity. (C) The velocity distributions for control and nocodazole treated samples generated from the absolute velocity maps. (D) The same data plotted on a log scale. (E) A pictorial representation of the graph in (D), where pixel intensity is equal to the number of pixels. The bar to the side shows the scaling. (F) The same data again, but plotted on a log-log graph. (G) A pictorial representation of the data in (F). (H) A maximum Z-projection of all of the absolute velocity maps in the time series. (I) A maximum Z-projection of all of the tracks produced by the Mass Particle Tracker plugin in the time series. (J) Overlay of the output of the LKMTA and Mass Particle Tracker algorithm in red and blue. There is a similar overall reduction in the flow maps and the number of tracks, as well as a correspondence between their distributions; bar = 25 μm.

