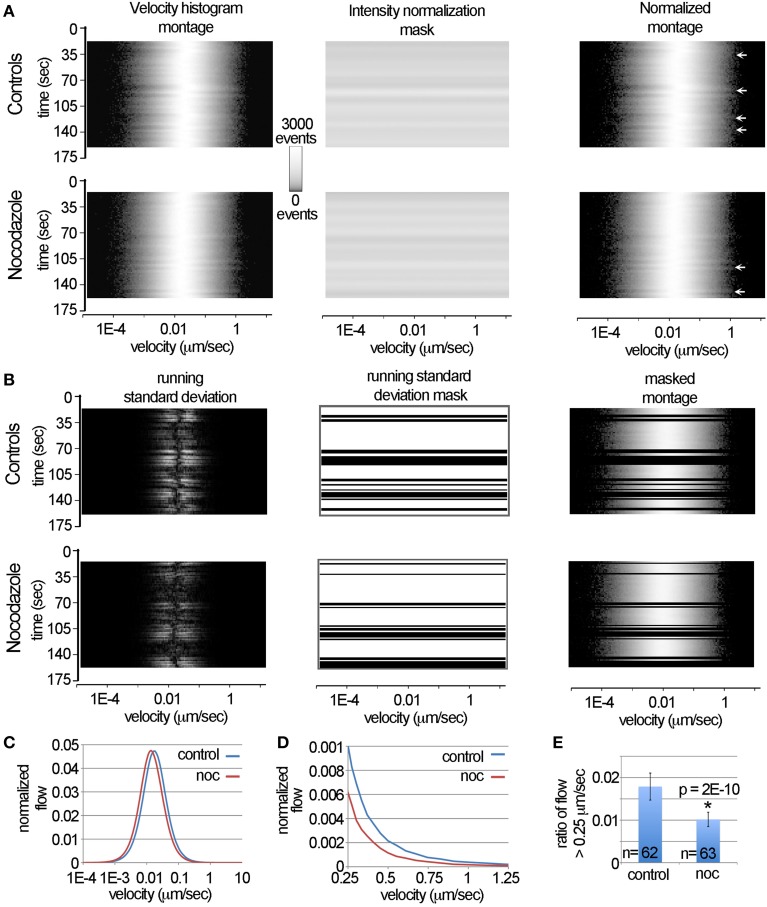
Figure 4.
Automated removal of spurious motion using the LKMTA. (A) Illustration of the steps used to normalize the velocity histograms produced by the LKMTA. (B) Illustration of the steps used to remove transient changes in the velocity profiles caused by stage drift and illumination flicker. (C) The plots of the velocity histograms of the pre-drug and post-nocodazole conditions. (D) The velocity profiles over the velocity range characteristic of fast mitochondrial transport. (E) The ratio of movements with velocities in the range of 0.25–4 μm/s for the control and nocodazole treated samples (ave ± sd).

