Figure 8.
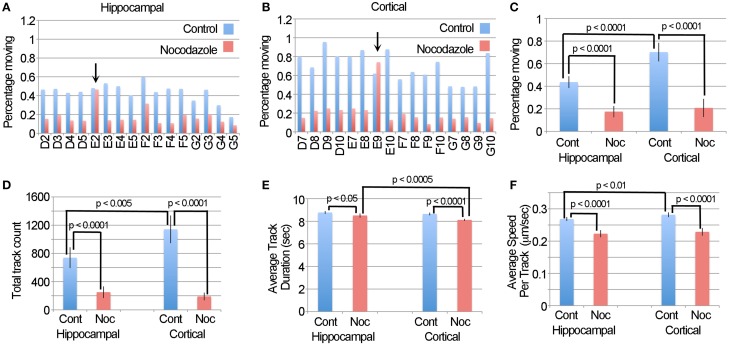
The DTA generates results that are similar to the LKMTA. (A) The percentage of moving mitochondria in hippocampal neurons before and after treatment with nocodazole as assessed by the DTA. The arrow points out the same well, as above, where spurious transport was observed. (B) The same data, but for cortical neurons. (C) A comparison of the percentage of moving mitochondria as function of cell type and nocodazole treatment. (D) Average track counts. (E) Average track durations. (F) Average speed per track. All error bars are 95% ci.

