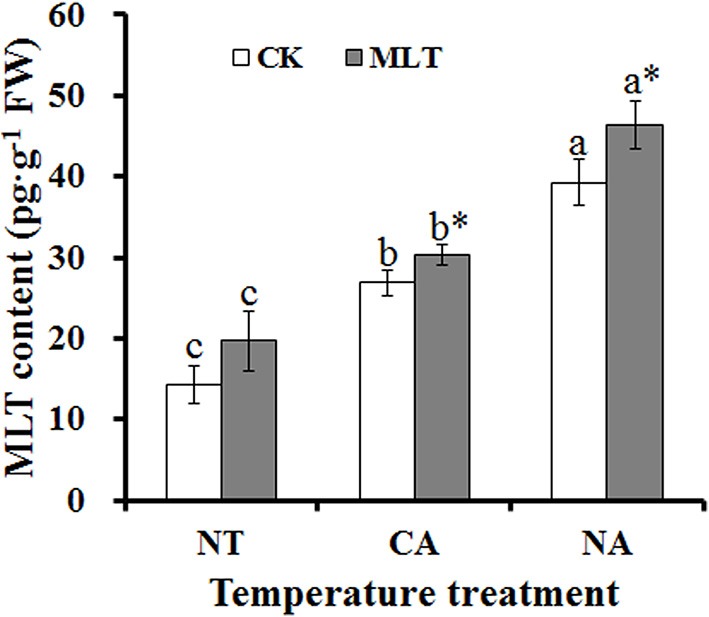
Figure 2.

Alterations of endogenous melatonin content in the leaves of Bermudagrass after 100 μM melatonin treatment under cold stress. Experiment included five repeats of each treatment, and means were average values of melatonin contents. Independent-samples t-test was used to determine statistical differences. Bars show standard deviation. Columns marked with different letters indicate statistical difference significance at P < 0.05 among the temperature treatments. Column marked with asterisk was significantly different after MLT treatment. NT was normal temperature of 30°C. CA was cold acclimation, which bermudagrass were treated with 4°C for 7 d and then transferred to −5°C for 8 h. NA was cold stress without acclimation, in which plants were treated with −5°C for 8 h without pre-treatment with 4°C. CK was control (treated without melatonin). MLT, melatonin; FW, fresh weight.
