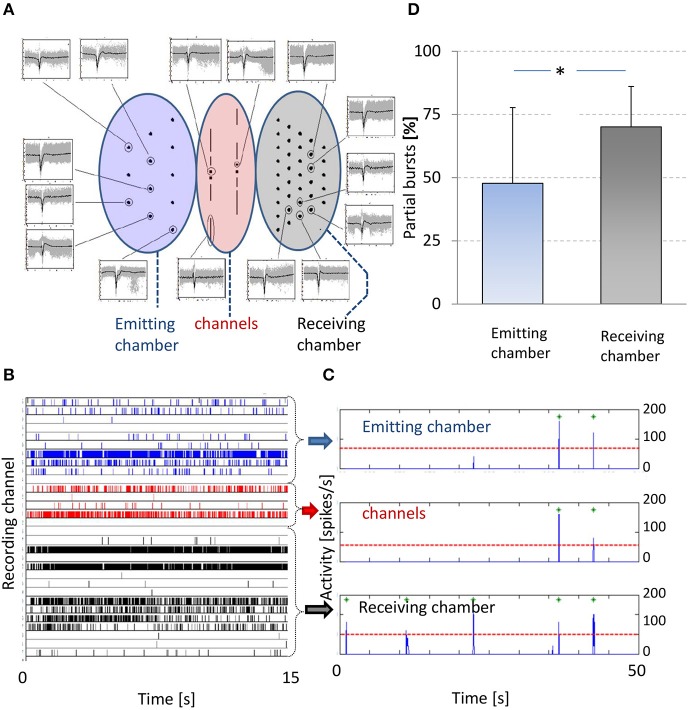
Figure 3.
Spontaneous activity. (A) Center shows electrode layout and the periphery shows recorded action potentials. Left oval area (blue) indicates electrodes in the emitting chamber, middle oval area (red) indicates channel electrodes and right oval area (gray) indicates electrodes in the receiving chamber. Examples of individual action potentials (gray) are shown and their average shapes (black) per electrode, obtained from a 10 min recoding from a 3 weeks old culture. Only signals are shown of electrodes that recorded more than five spikes per minute. Horizontal axes span 6 ms, vertical axes are scaled to fit; mean amplitudes ranged 50–300 μV. (B) Raster plot of 15 s of recorded activity. Vertical axis indicates all recording electrodes, action potentials recorded by an electrode are indicated by tics in the corresponding row. All tics are color-coded to indicate the location of the recording electrode, blue (rows 1–10): receiving chamber, gray (rows 16–30): emitting chamber, and red (rows 11–15): channels. (C) Summed activity in 5 ms bins (blue line). A threshold ( ) based burst detection algorithm found all bursts in either chamber and in the channels (
 ). (D) Percentages of partial bursts in the emitting (blue) and receiving chamber (gray). Partial bursts were defined as any burst that occurred in one chamber at t = τ with no burst in the other chamber during the interval t = [τ−400; τ+400 ms]. The occurrence of partial bursts were expressed as percentages of the total number of bursts in either chamber. * paired t-test: p < 0.01.

