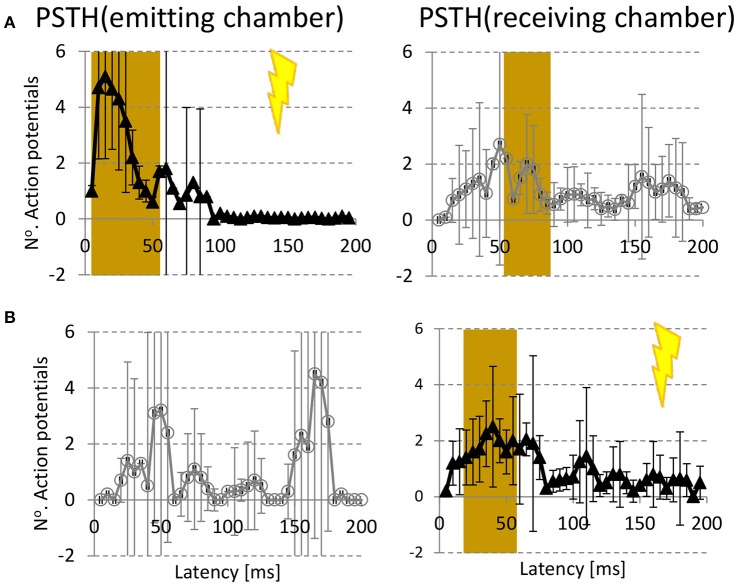
Figure 4.
Stimulus responses. (A) Average post stimulus time histogram (PSTH) in emitting (left column) and receiving chamber (right column) to electrical stimulation in emitting chamber ( ) (B) PSTH(emitting chamber) and PSTH (receiving chamber) in response to stimulation in the receiving chamber (
 ). Error bars indicate 95% confidence intervals (= 1.96 × SEM), and represent differences between experiments (n = 12). Responses were considered significant if the 95% confidence interval did not include 0 in 2 consecutive time bins. Significant responses are indicated by brown backgrounds.

