
Figure 3.
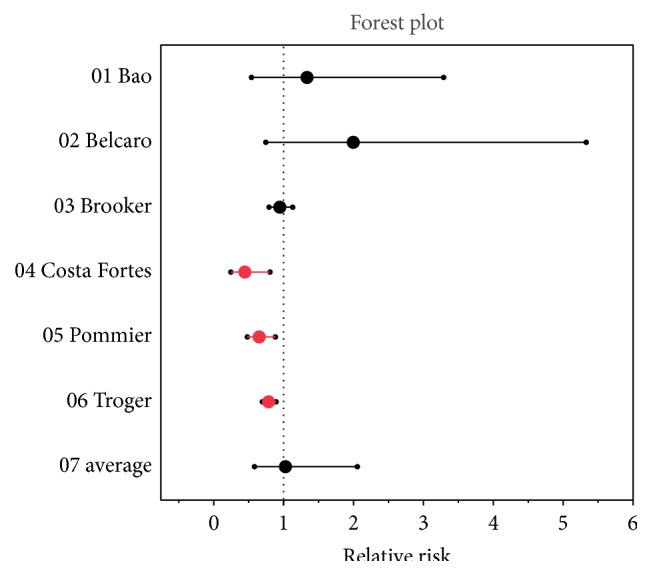
Forrest plot results of the systematic review. Note: Pawar and colleagues (the SAMITAL study) were excluded due to low N and methodological uncertainty.
Official websites use .gov
A
.gov website belongs to an official
government organization in the United States.
Secure .gov websites use HTTPS
A lock (
) or https:// means you've safely
connected to the .gov website. Share sensitive
information only on official, secure websites.
Forrest plot results of the systematic review. Note: Pawar and colleagues (the SAMITAL study) were excluded due to low N and methodological uncertainty.