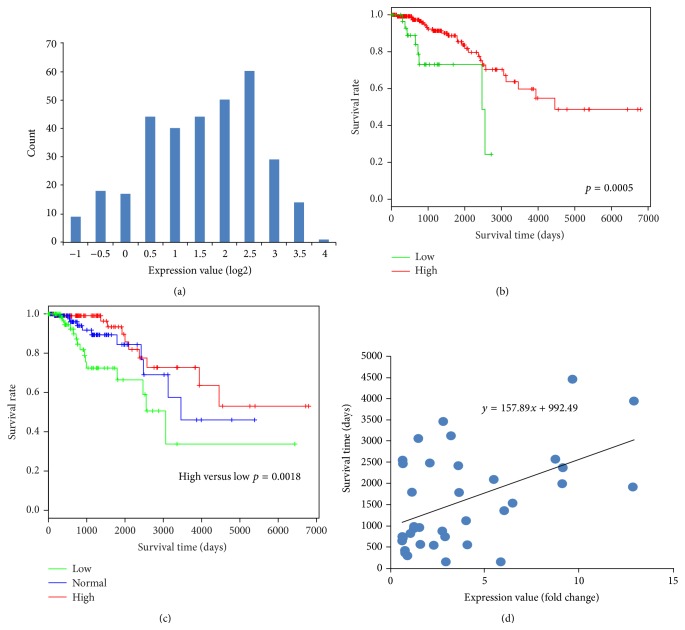
Figure 5.
HSPA2 plays a different role in breast cancer. (a) Histogram of HSPA2 expression value. (b) Survival curves of HSPA2 high expression and low expression. (c) Survival curves of 3 patient groups that are grouped by K-means of HSPA2 gene expression values. (d) The correlations of death days with HSPA2 expression value.

