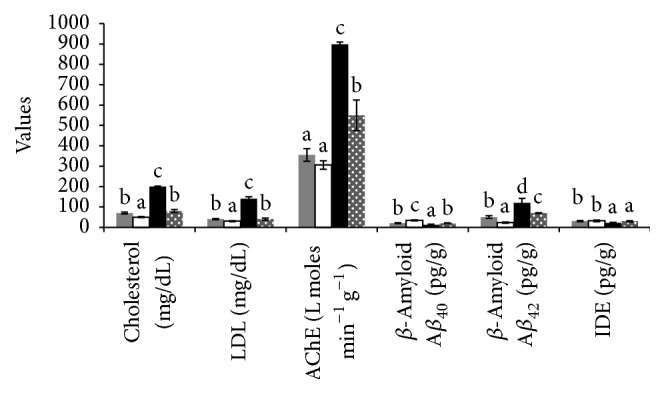
Figure 2.

Effect of berberine treatment on serum cholesterol, LDL and brain tissue AChE, Aβ 40, Aβ 42, and IDE. C: control group, BC: berberine control group, NASH: the CCL4-NASH induced group, and Bt: the CCl4-NASH induced group treated with berberine. Control group (gray bars), berberine control group (white bars), NASH induced group (black bars), and NASH induced group treated with berberine (dotted gray bars).
